Market Briefing
Fav
Daily Pulse
Weekly Pulse
IBKR
Sentiment
Misc
Short-Squeeze Watch
FINRA consolidated short interest as of 2026-09-18. Scanned 1155 US tickers; 0 flagged as potential short-squeeze setups.
No tickers crossed the squeeze threshold this period.
This content is for informational purposes only and does not constitute financial, investment, or trading advice. Always consult a qualified financial professional before making any investment decisions.
Short-Squeeze Watch
FINRA consolidated short interest as of 2026-08-14. Scanned 1145 US tickers; 34 crossed the squeeze threshold — showing the top 25 by score.
⭐ 4 of these also show open-market insider buying in the last 90 days — the higher-conviction squeeze × insider subset, which is the only subset with a real forward edge in backtest. These are listed first and marked ⭐.
| Ticker | Score | Insider Buy | Short % Float | Days-to-Cover | DTC z | Δ Short Int |
|---|---|---|---|---|---|---|
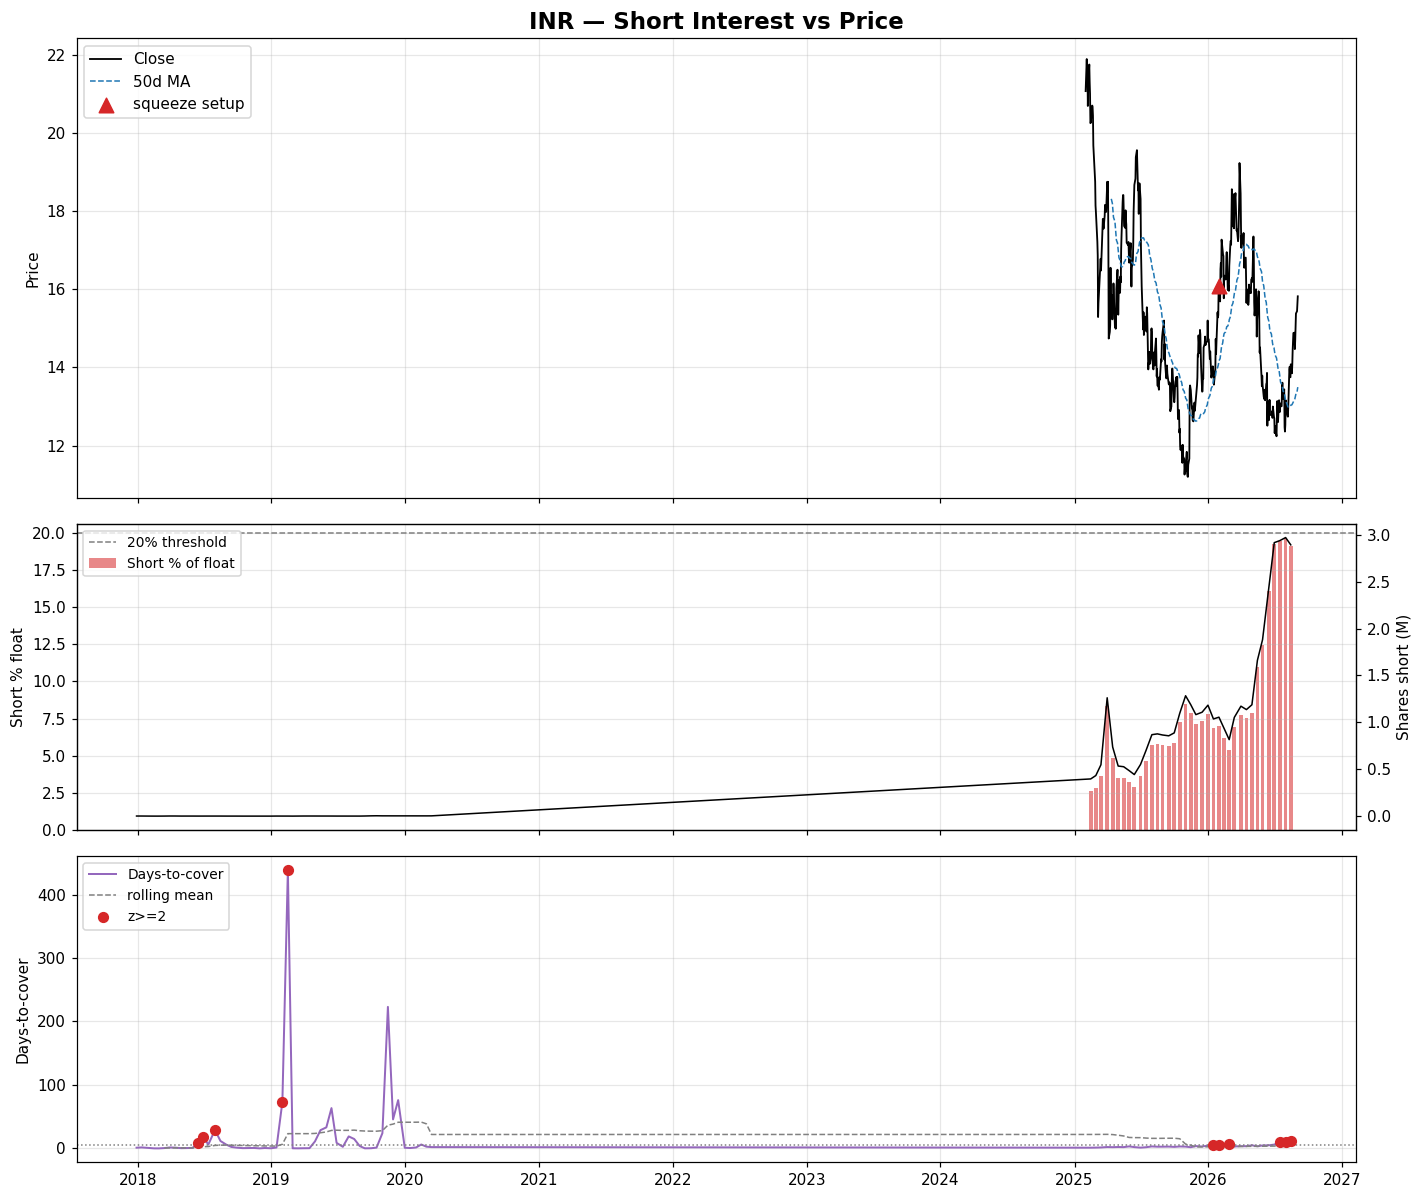
| INR | 1.21 | ⭐ $609K | 19.1% | 11.0 | 2.6 | -3% |
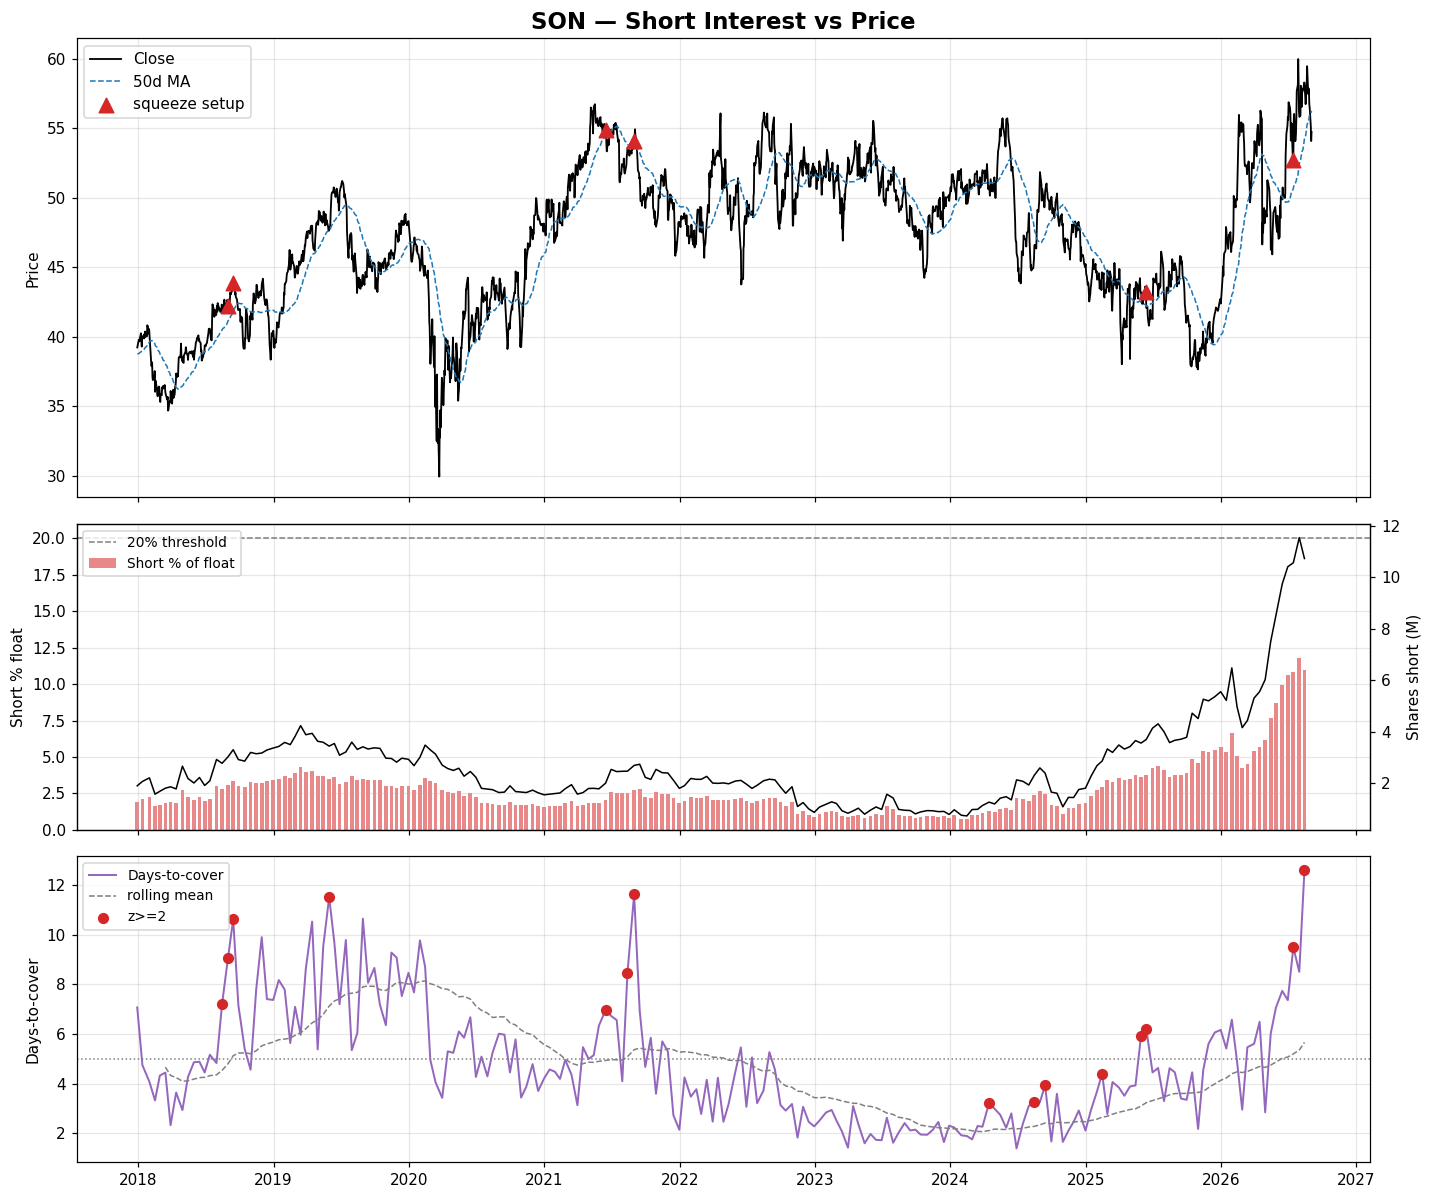
| SON | 1.14 | ⭐ $249K | 11.0% | 12.6 | 3.0 | -7% |
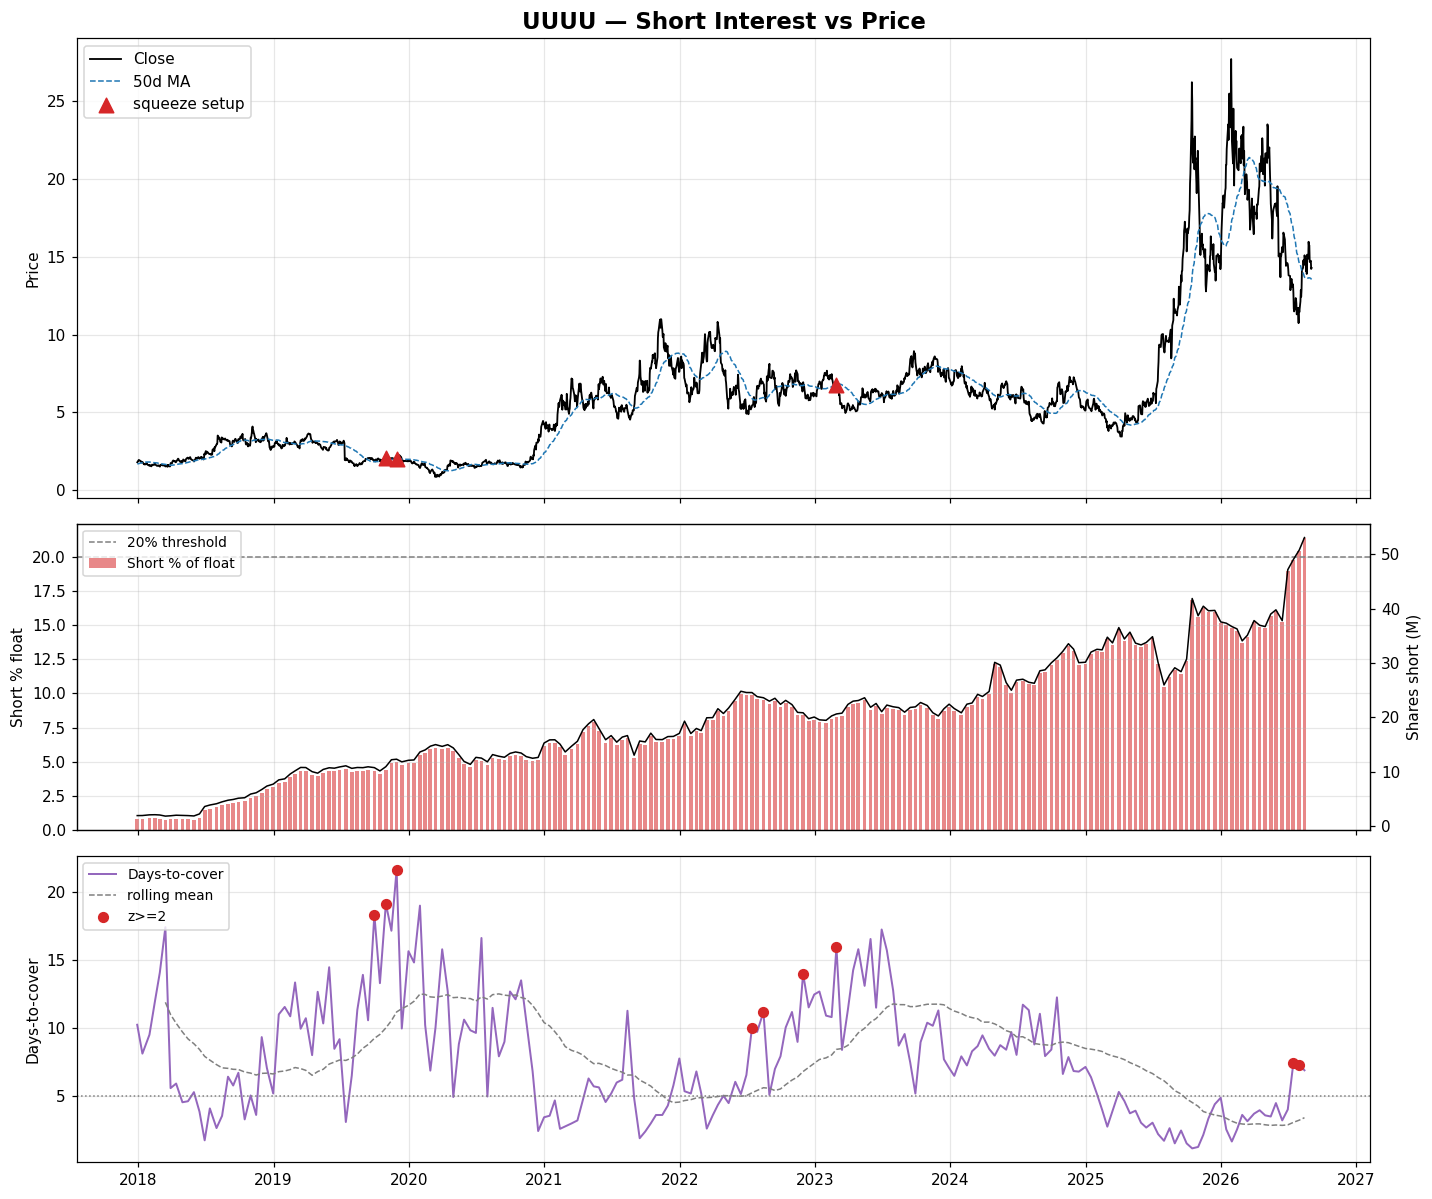
| UUUU | 1.11 | ⭐ $51K | 21.4% | 6.9 | 2.0 | +4% |
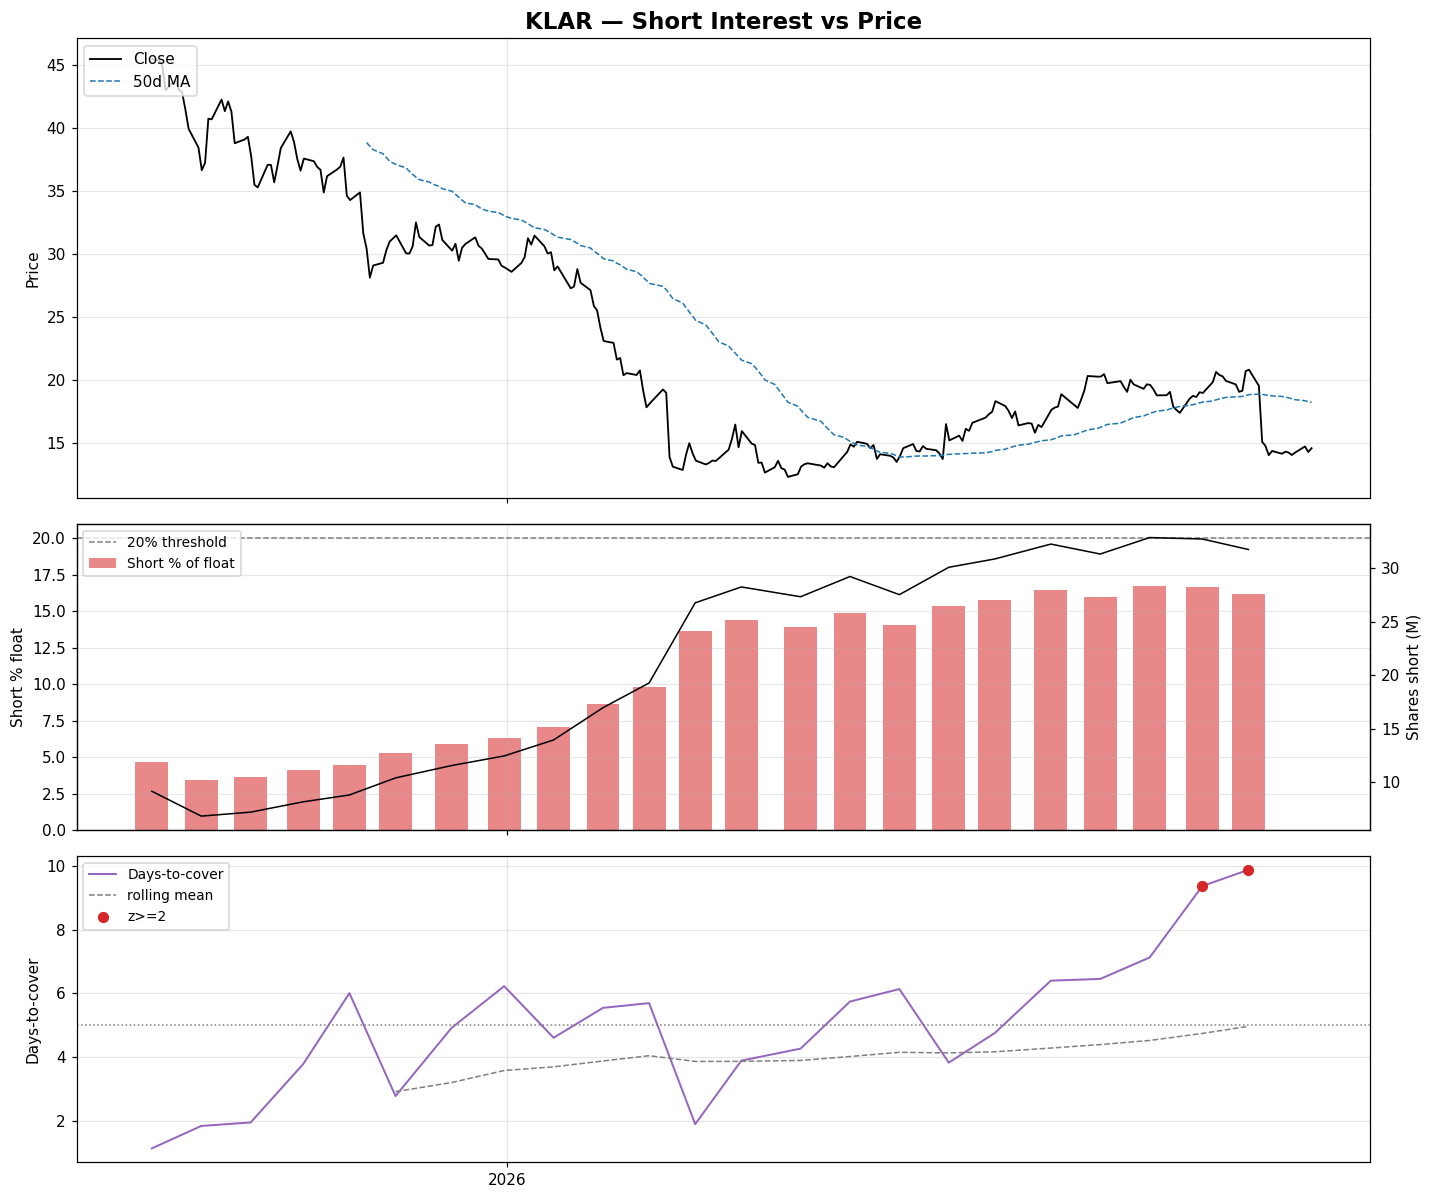
| KLAR | 1.11 | ⭐ $9.9M | 16.2% | 9.9 | 2.2 | -3% |
| AI | 1.47 | — | 34.7% | 11.5 | 2.0 | +4% |
| IRON | 1.31 | — | 22.3% | 24.8 | 3.0 | -1% |
| GFL | 1.30 | — | 7.5% | 12.4 | 3.9 | +2% |
| RHI | 1.26 | — | 24.5% | 14.0 | 2.3 | -6% |
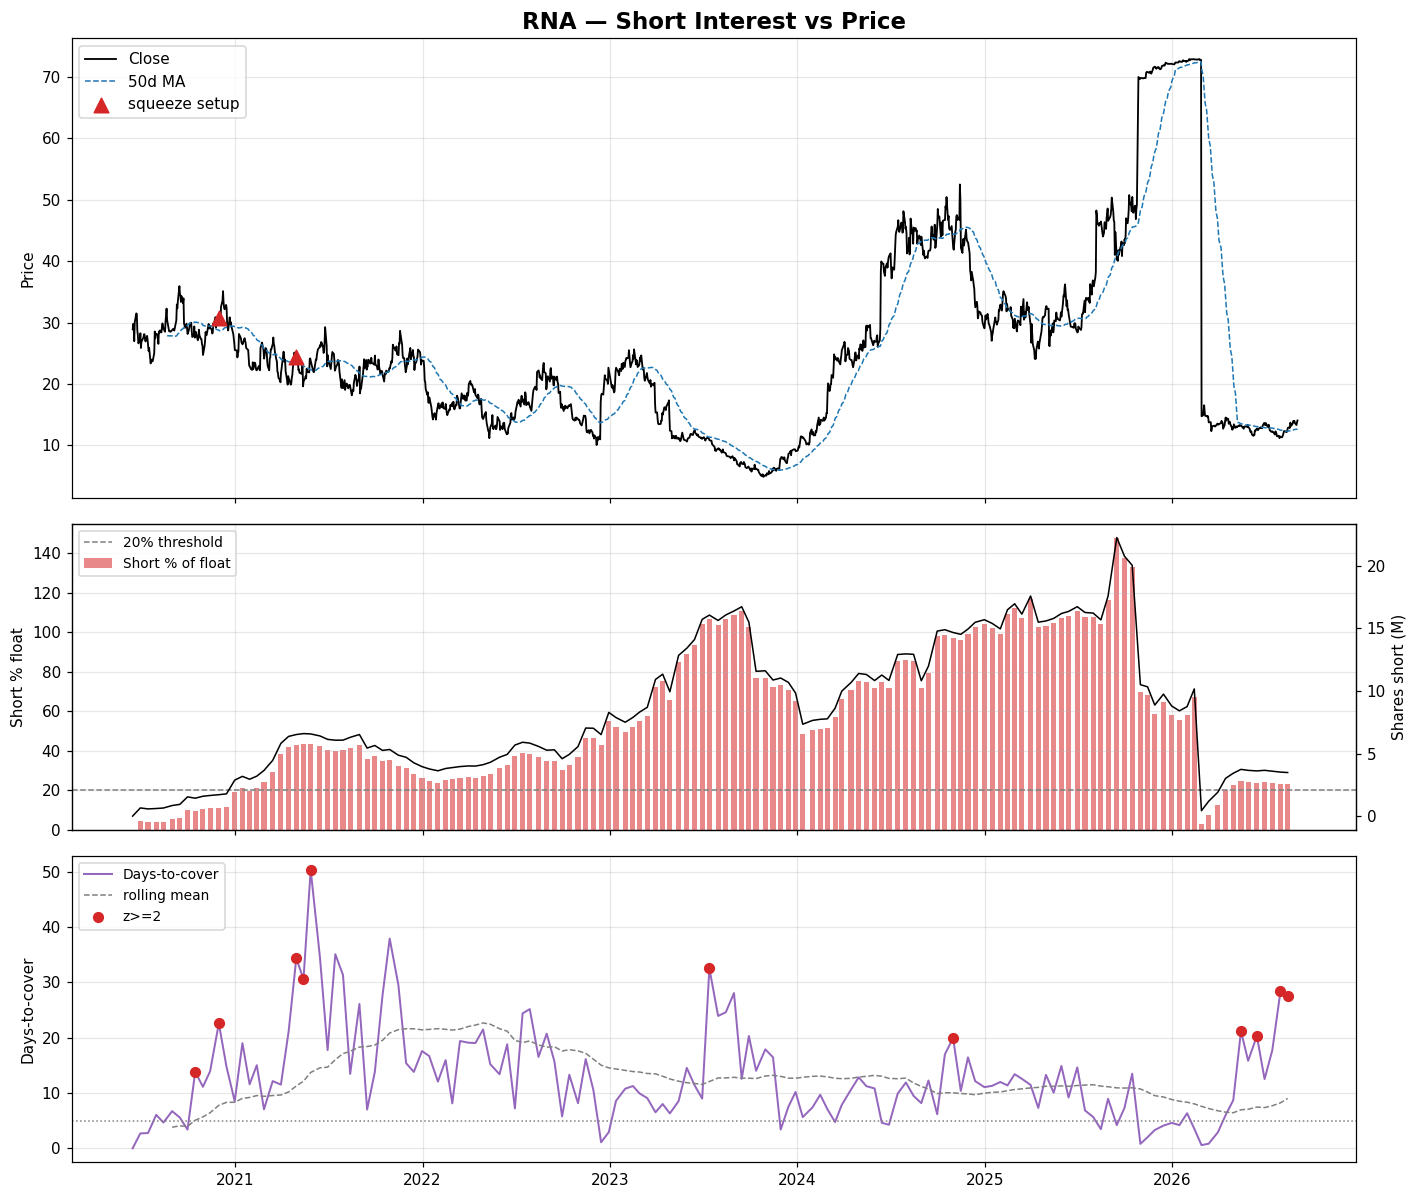
| RNA | 1.23 | — | 23.1% | 27.5 | 2.3 | -1% |
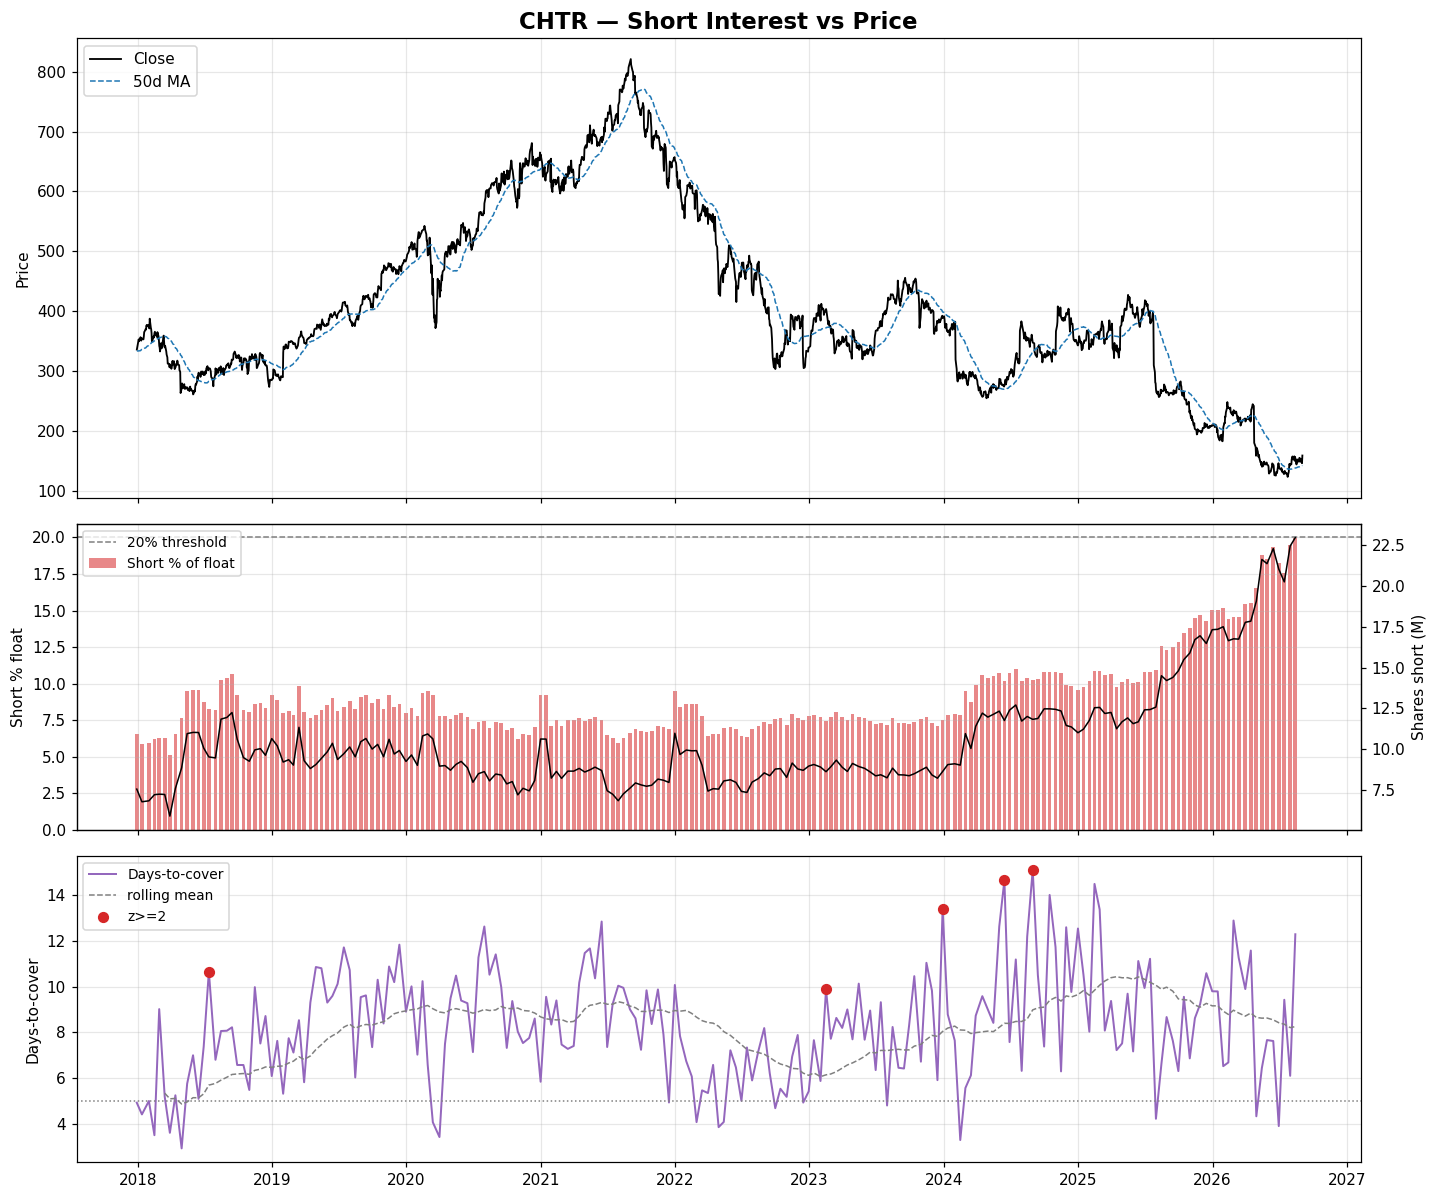
| CHTR | 1.21 | — | 19.9% | 12.3 | 1.7 | +2% |
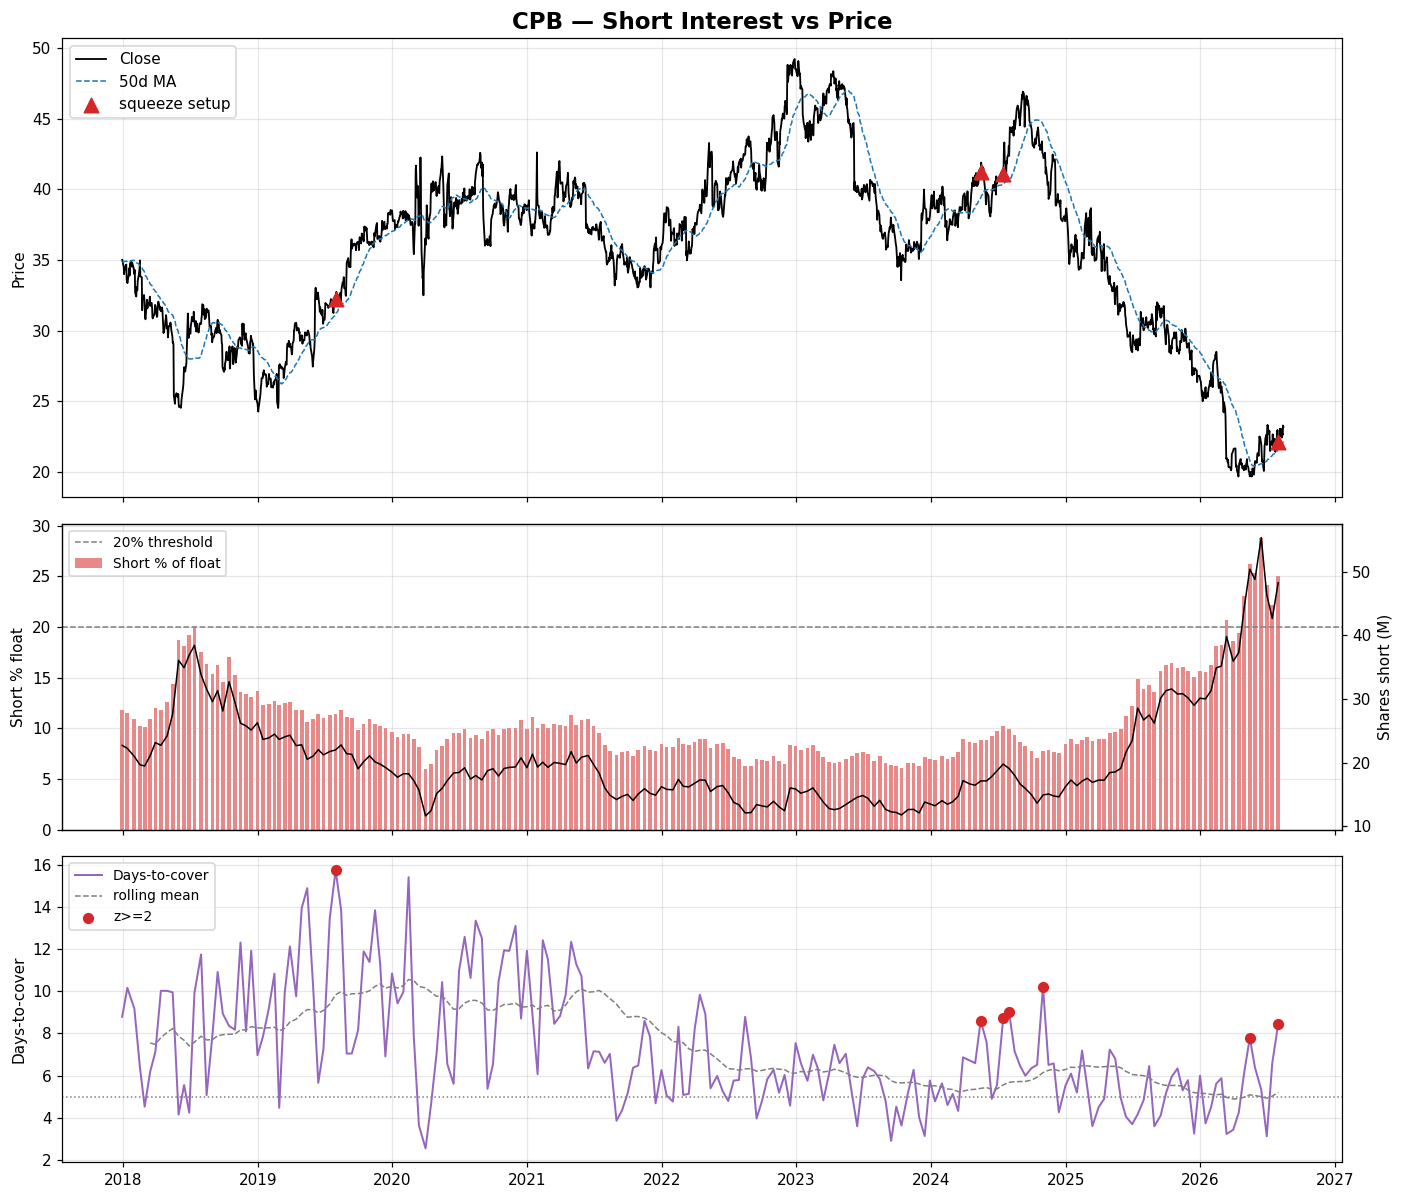
| CPB | 1.17 | — | 21.7% | 9.1 | 2.3 | -13% |
| BEKE | 1.15 | — | 3.9% | 10.3 | 3.1 | +4% |
| PCVX | 1.14 | — | 10.8% | 15.9 | 2.2 | +2% |
| TAP | 1.12 | — | 17.3% | 10.1 | 2.1 | -4% |
| TNL | 1.11 | — | 11.5% | 11.2 | 2.7 | -1% |
| TEM | 1.11 | — | 25.8% | 7.3 | 2.1 | -10% |
| KMB | 1.10 | — | 13.4% | 11.8 | 1.6 | +1% |
| LEN | 1.10 | — | 8.6% | 9.0 | 2.5 | +3% |
| NE | 1.09 | — | 9.4% | 12.4 | 2.8 | -1% |
| SPTX | 1.07 | — | 16.3% | 25.1 | 1.0 | +9% |
| MGA | 1.06 | — | 4.1% | 9.2 | 2.7 | +13% |
| GPCR | 1.06 | — | 11.1% | 10.4 | 1.5 | +0% |
| CRSP | 1.06 | — | 19.5% | 15.6 | 1.3 | -0% |
| LYV | 1.06 | — | 15.6% | 12.2 | 1.8 | -0% |
| GOLD | 1.06 | — | 16.1% | 8.0 | 1.7 | +4% |
Charts
INR
SON
UUUU
KLAR
AI
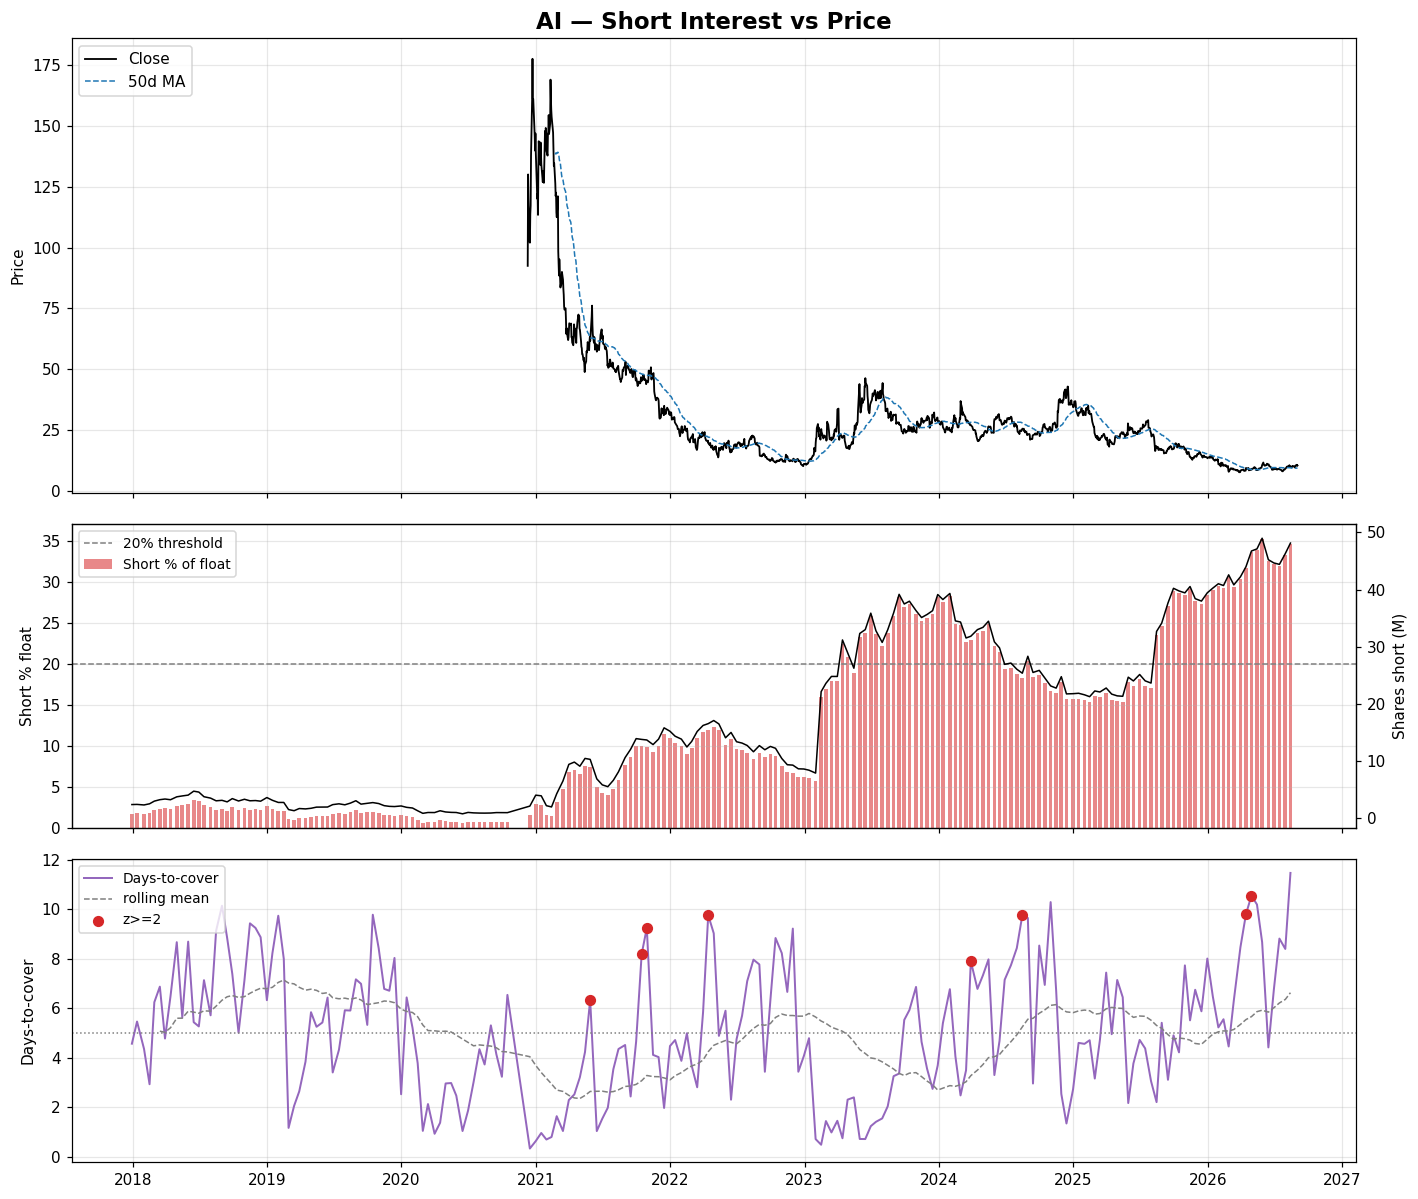
IRON
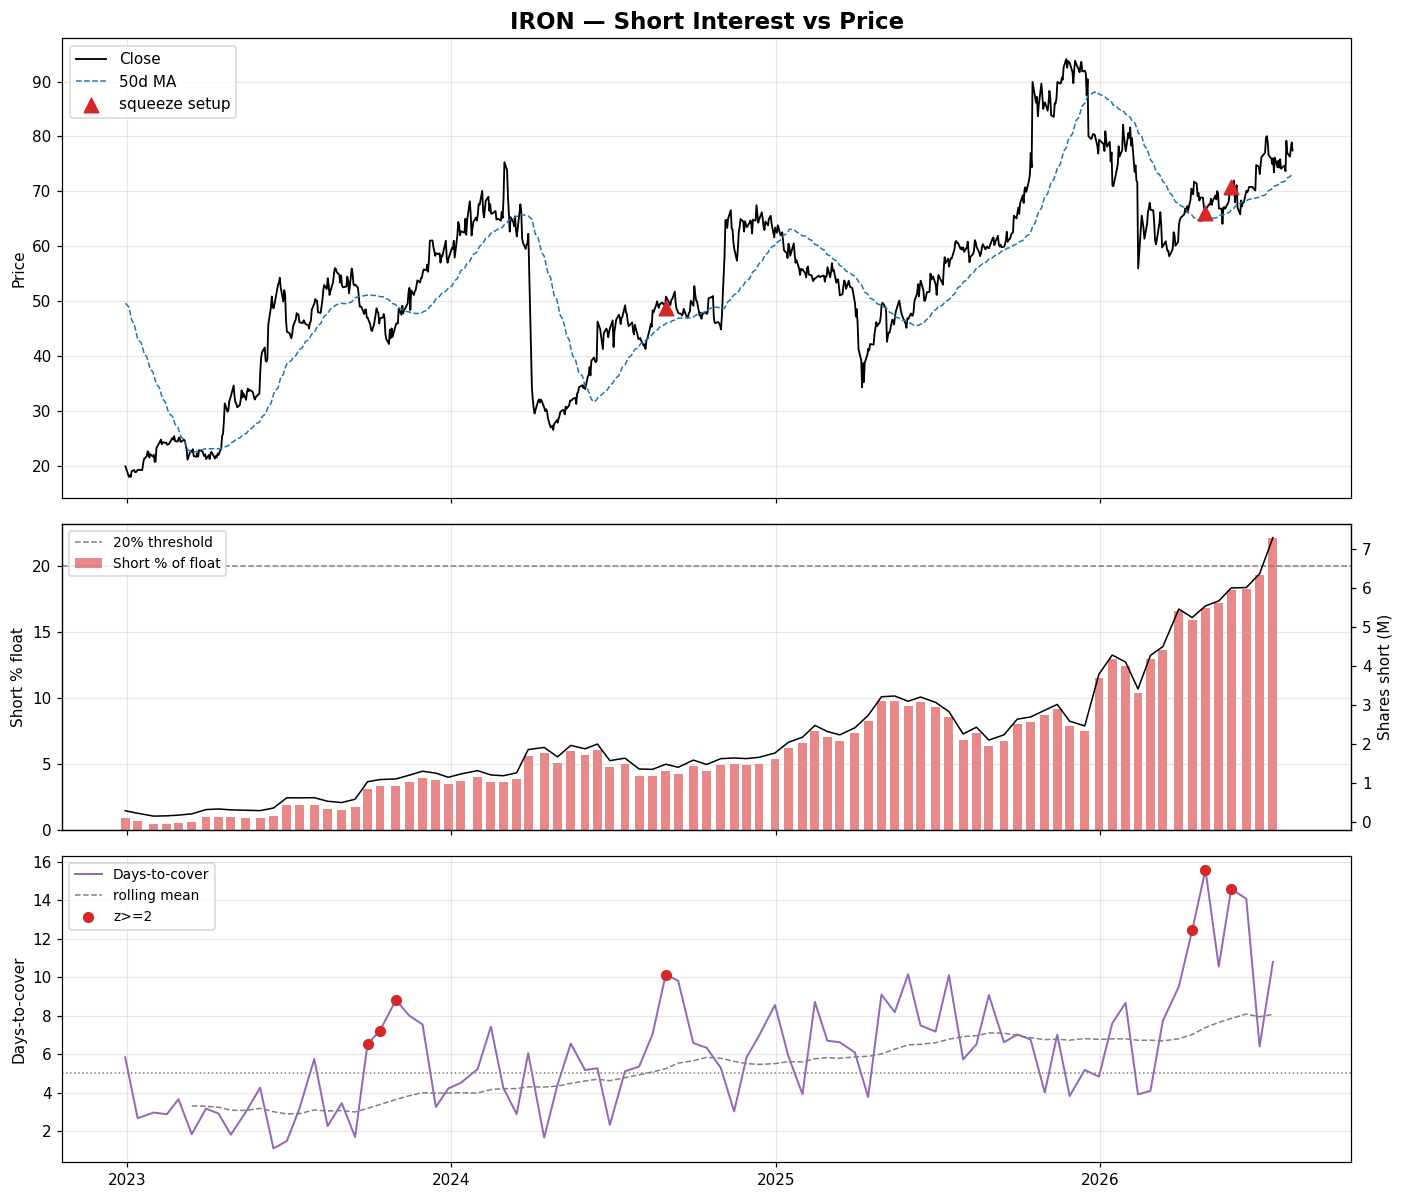
GFL
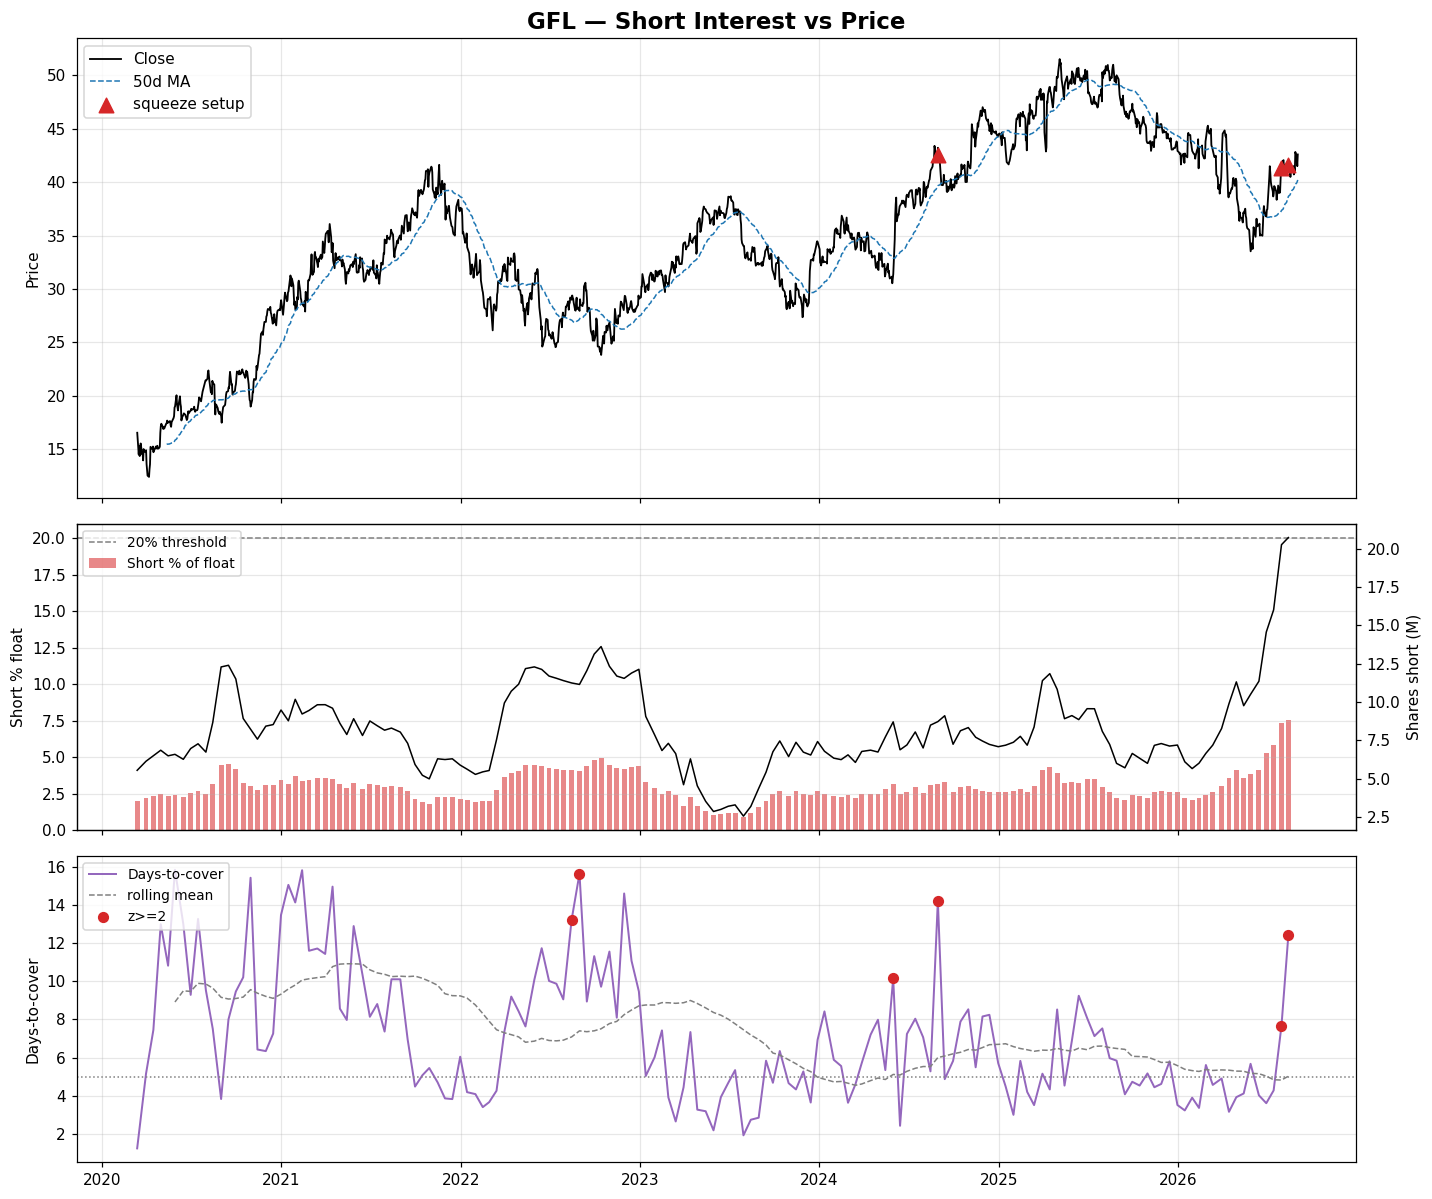
RHI
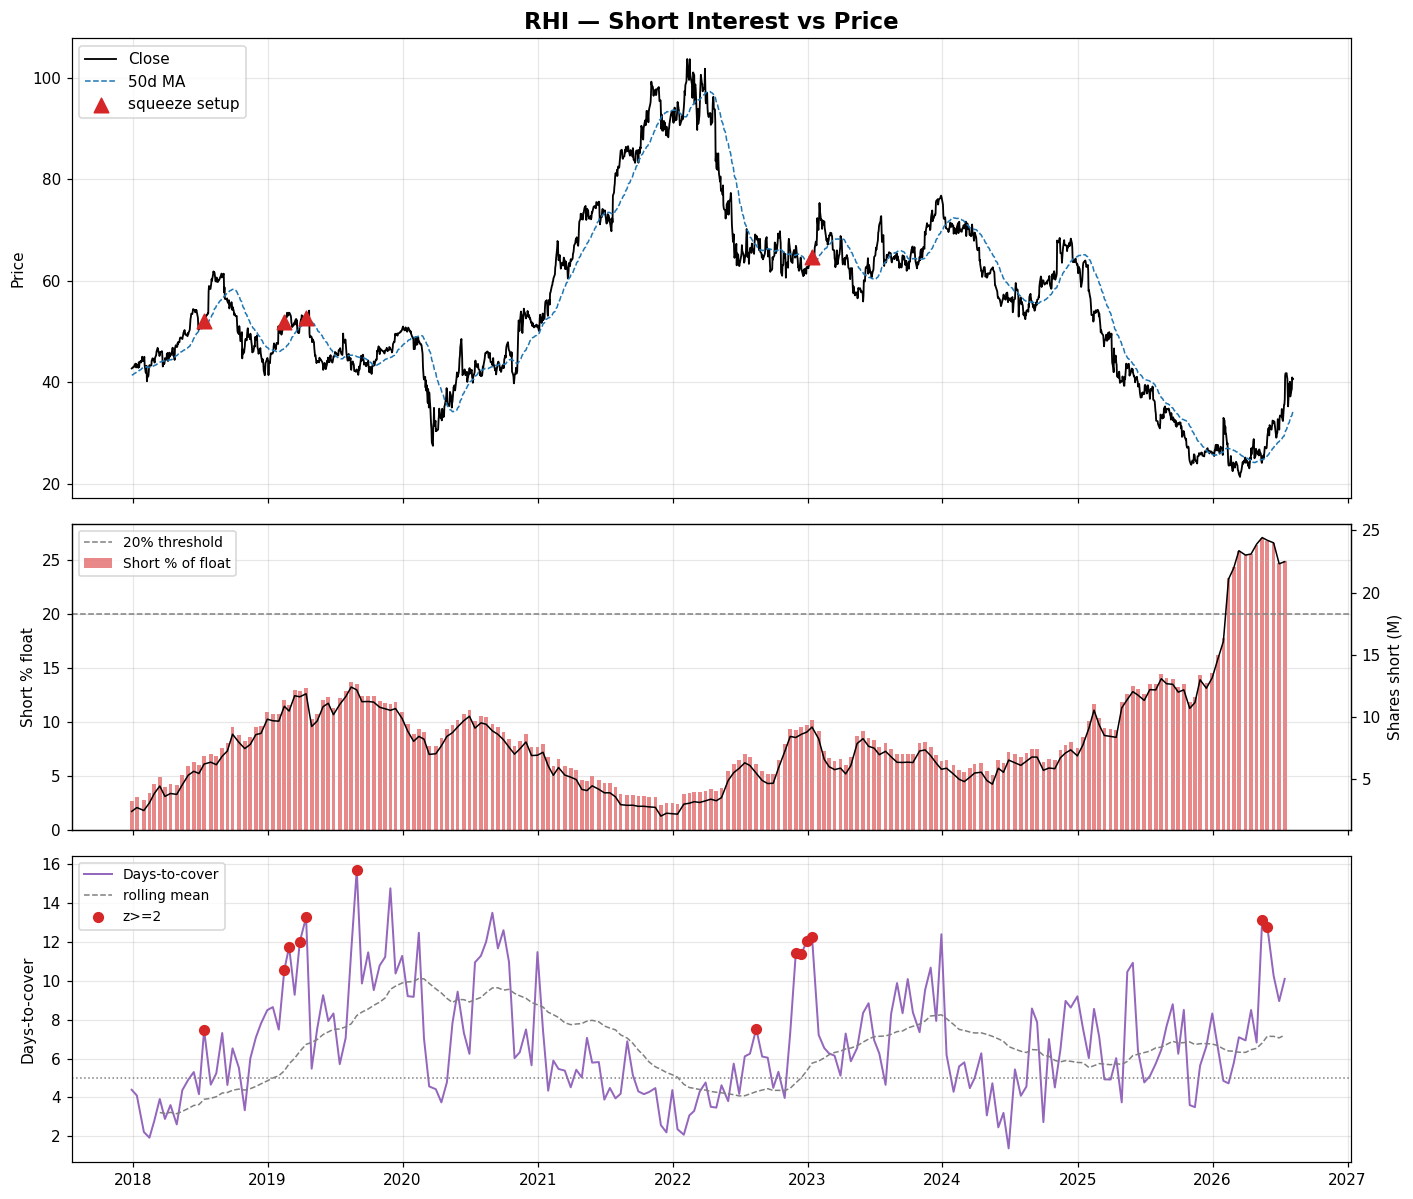
RNA
CHTR
CPB
BEKE
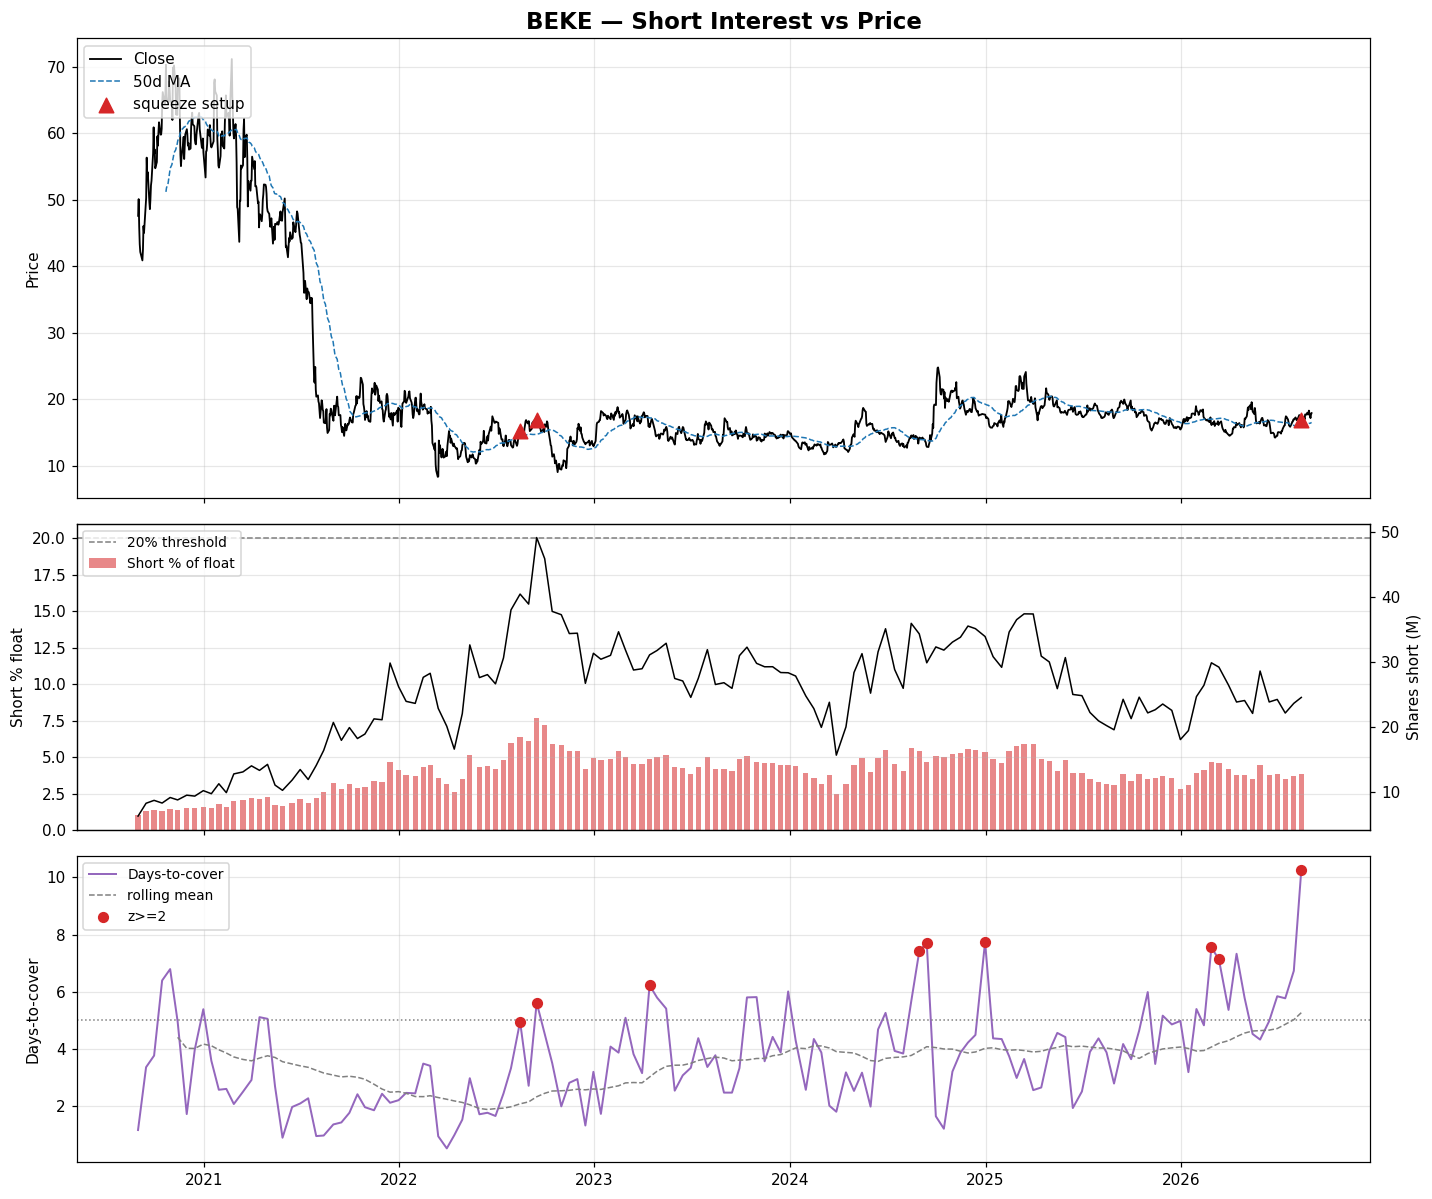
How to read this: a higher score means a more crowded, harder-to-cover short base that is still building while price reclaims its 50-day moving average — the classic squeeze setup. Days-to-cover is recomputed as shares-short / average-daily-volume (FINRA floors its own value at 1.00); the z-score compares it to the ticker's own history. Short interest is reported fortnightly with a ~2-day publication lag, so treat this as a swing-horizon watchlist, not an intraday signal.
This content is for informational purposes only and does not constitute financial, investment, or trading advice. Always consult a qualified financial professional before making any investment decisions.
Short-Squeeze Watch
FINRA consolidated short interest as of 2026-07-31. Scanned 1114 US tickers; 30 crossed the squeeze threshold — showing the top 25 by score.
⭐ 3 of these also show open-market insider buying in the last 90 days — the higher-conviction squeeze × insider subset, which is the only subset with a real forward edge in backtest. These are listed first and marked ⭐.
| Ticker | Score | Insider Buy | Short % Float | Days-to-Cover | DTC z | Δ Short Int |
|---|---|---|---|---|---|---|
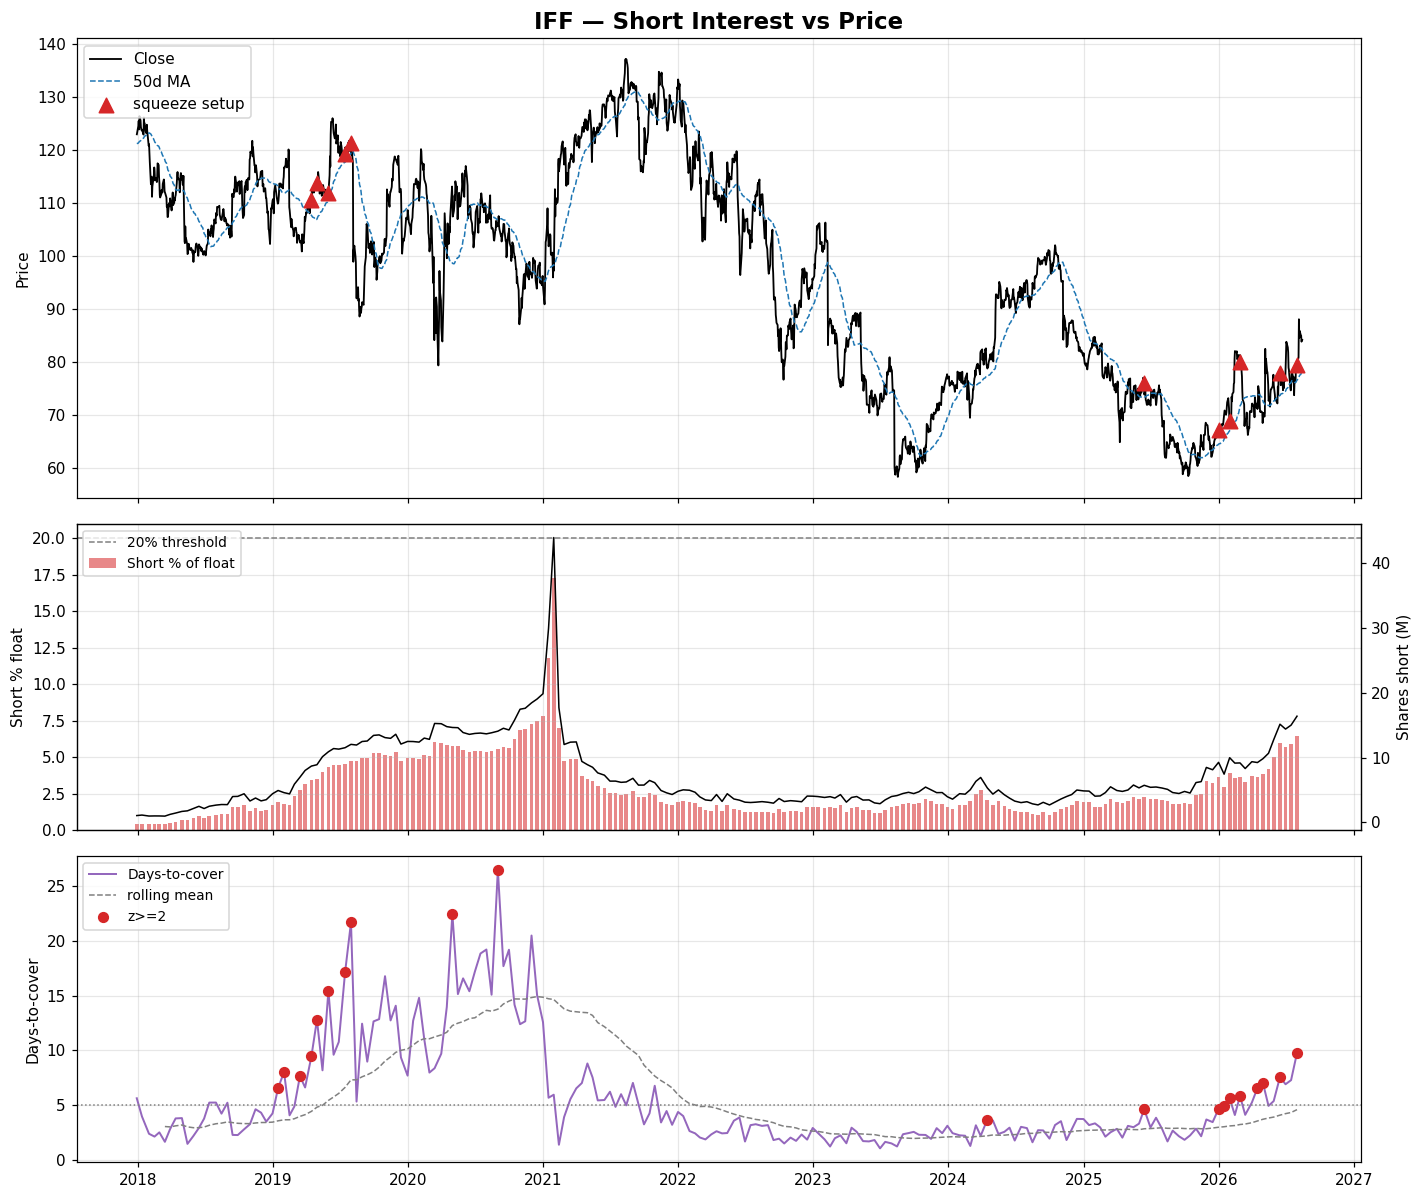
| IFF | 1.10 | ⭐ $20.3M | 6.4% | 9.8 | 2.5 | +9% |
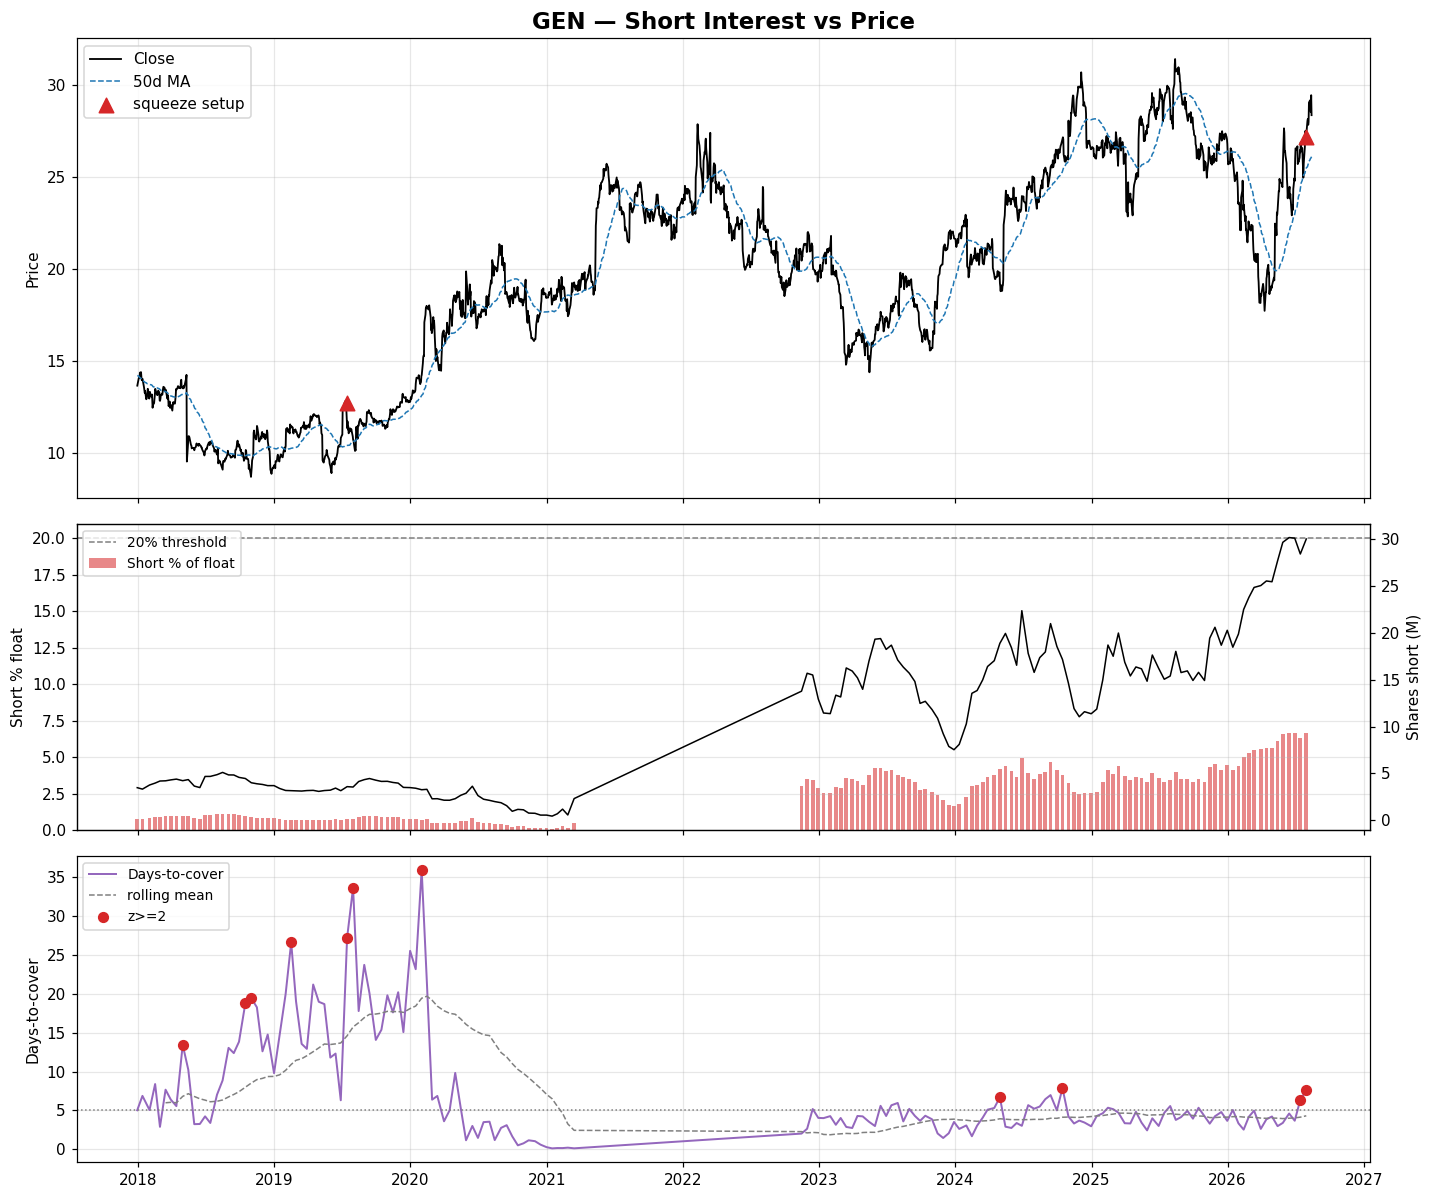
| GEN | 1.05 | ⭐ $81K | 6.6% | 7.6 | 2.9 | +6% |
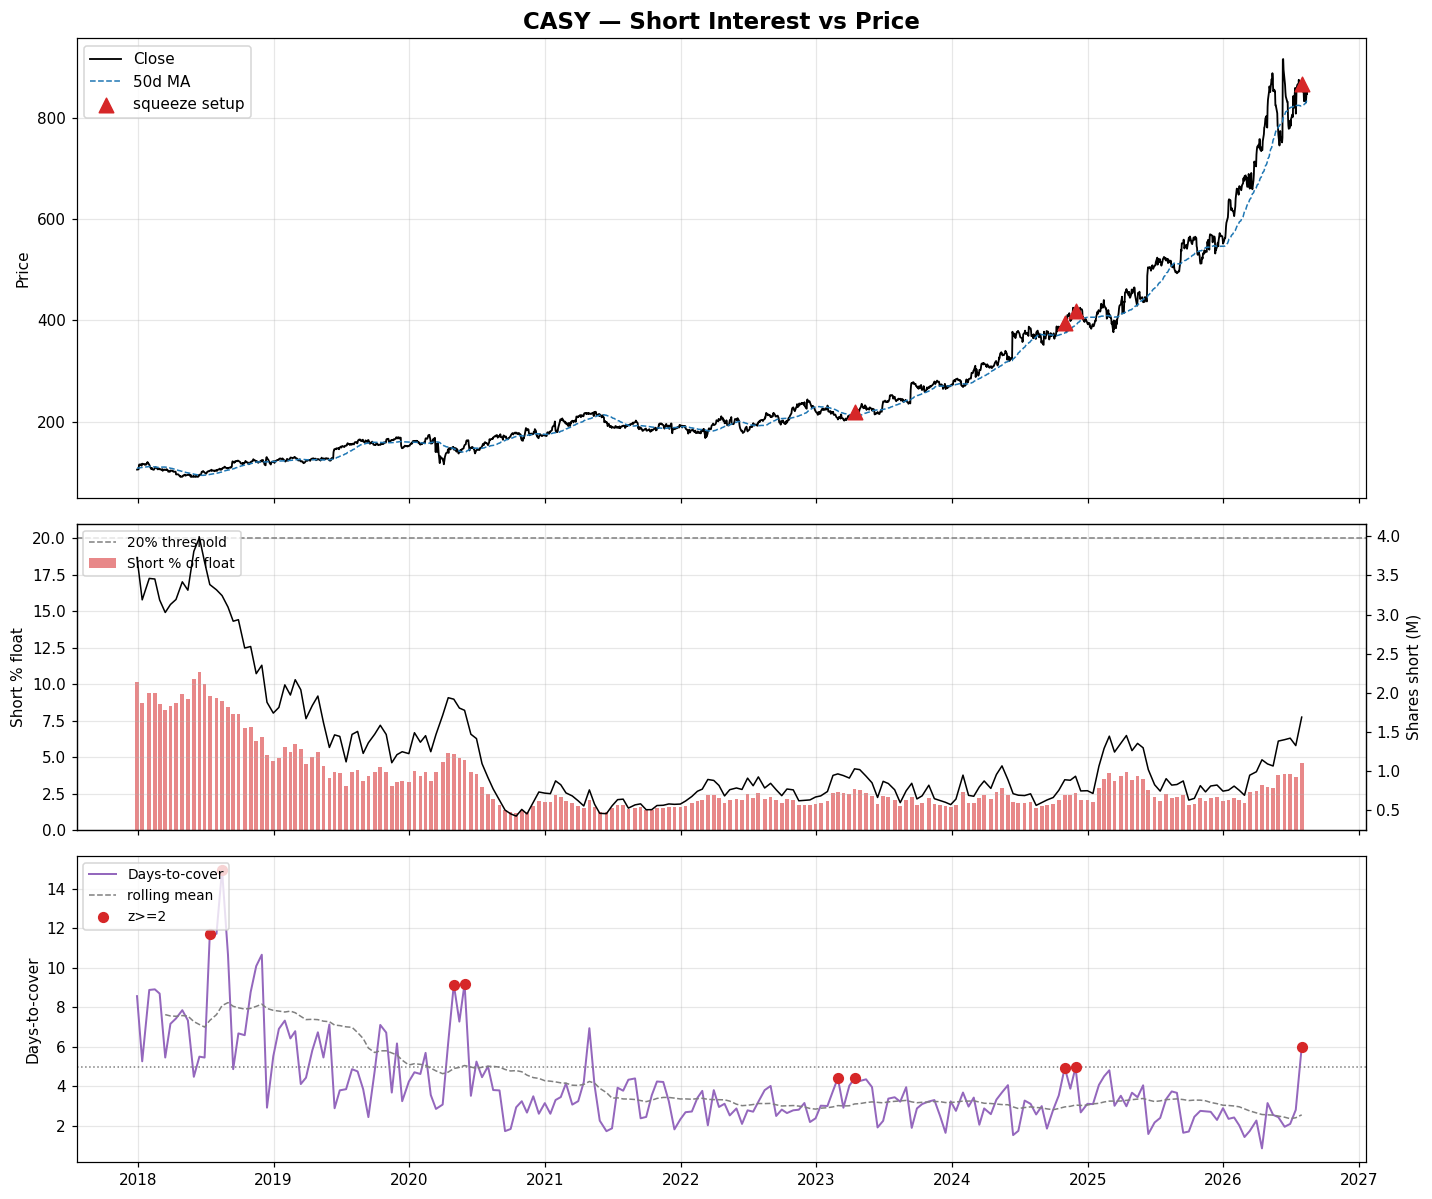
| CASY | 1.01 | ⭐ $199K | 4.6% | 6.0 | 3.6 | +27% |
| IRON | 1.41 | — | 22.4% | 20.9 | 2.9 | +1% |
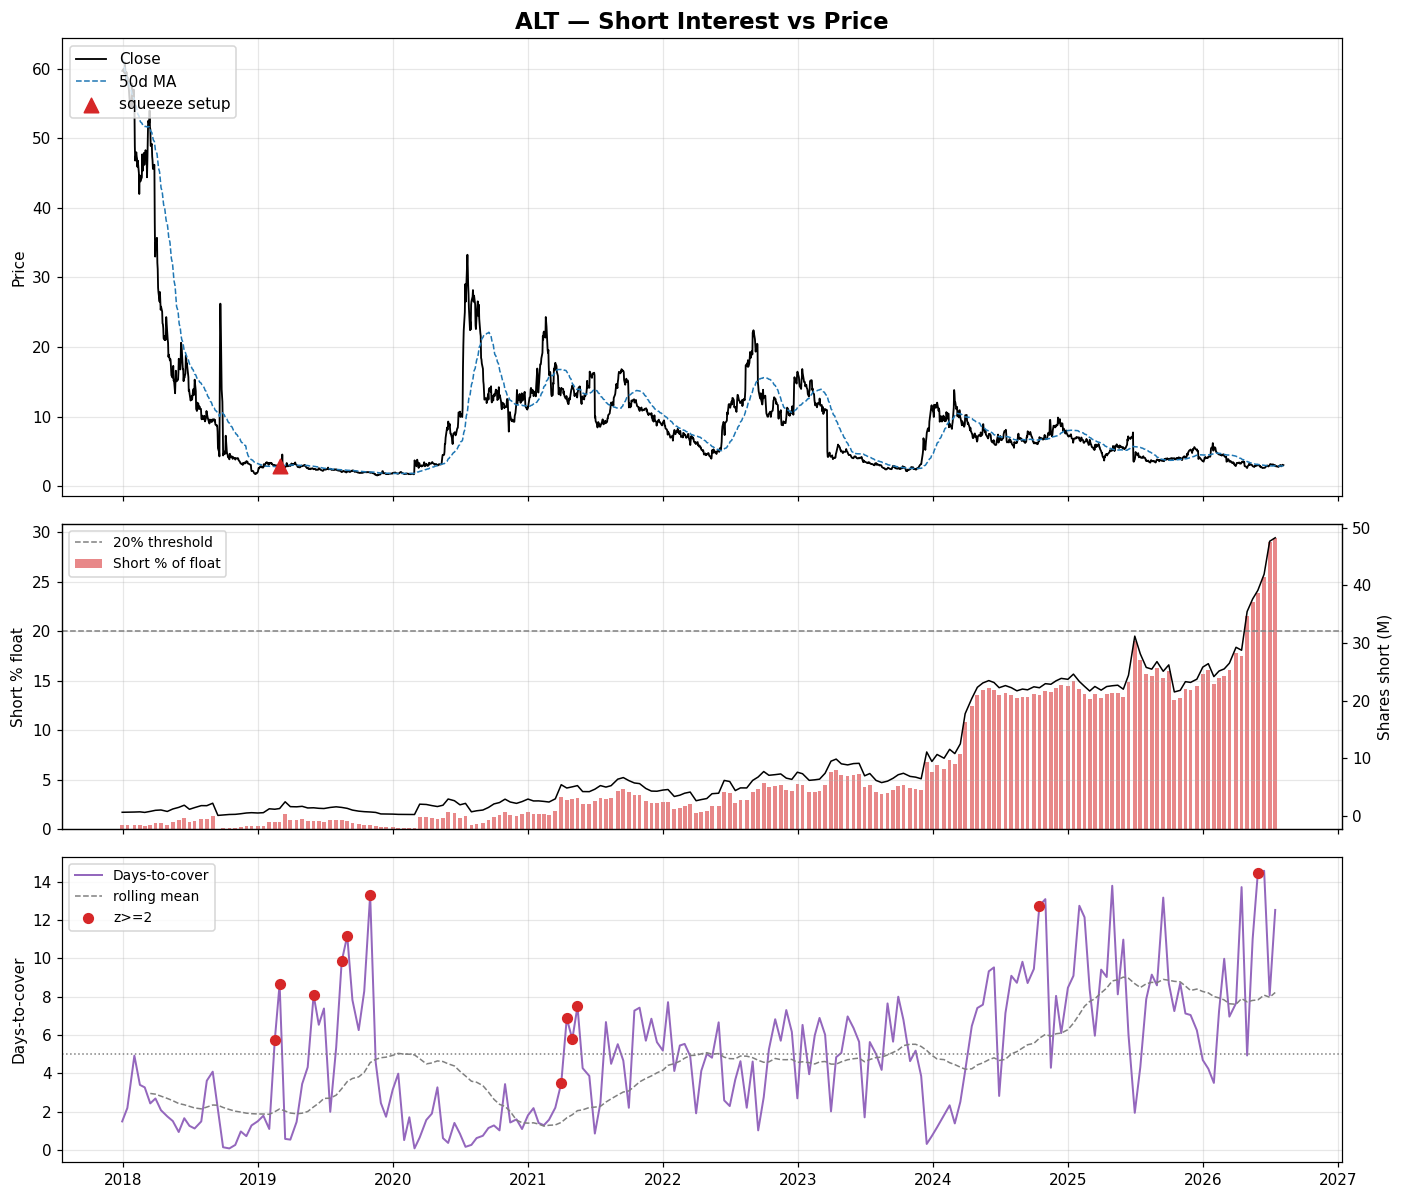
| ALT | 1.29 | — | 31.6% | 11.5 | 0.9 | +8% |
| CPB | 1.28 | — | 25.1% | 8.4 | 2.3 | +13% |
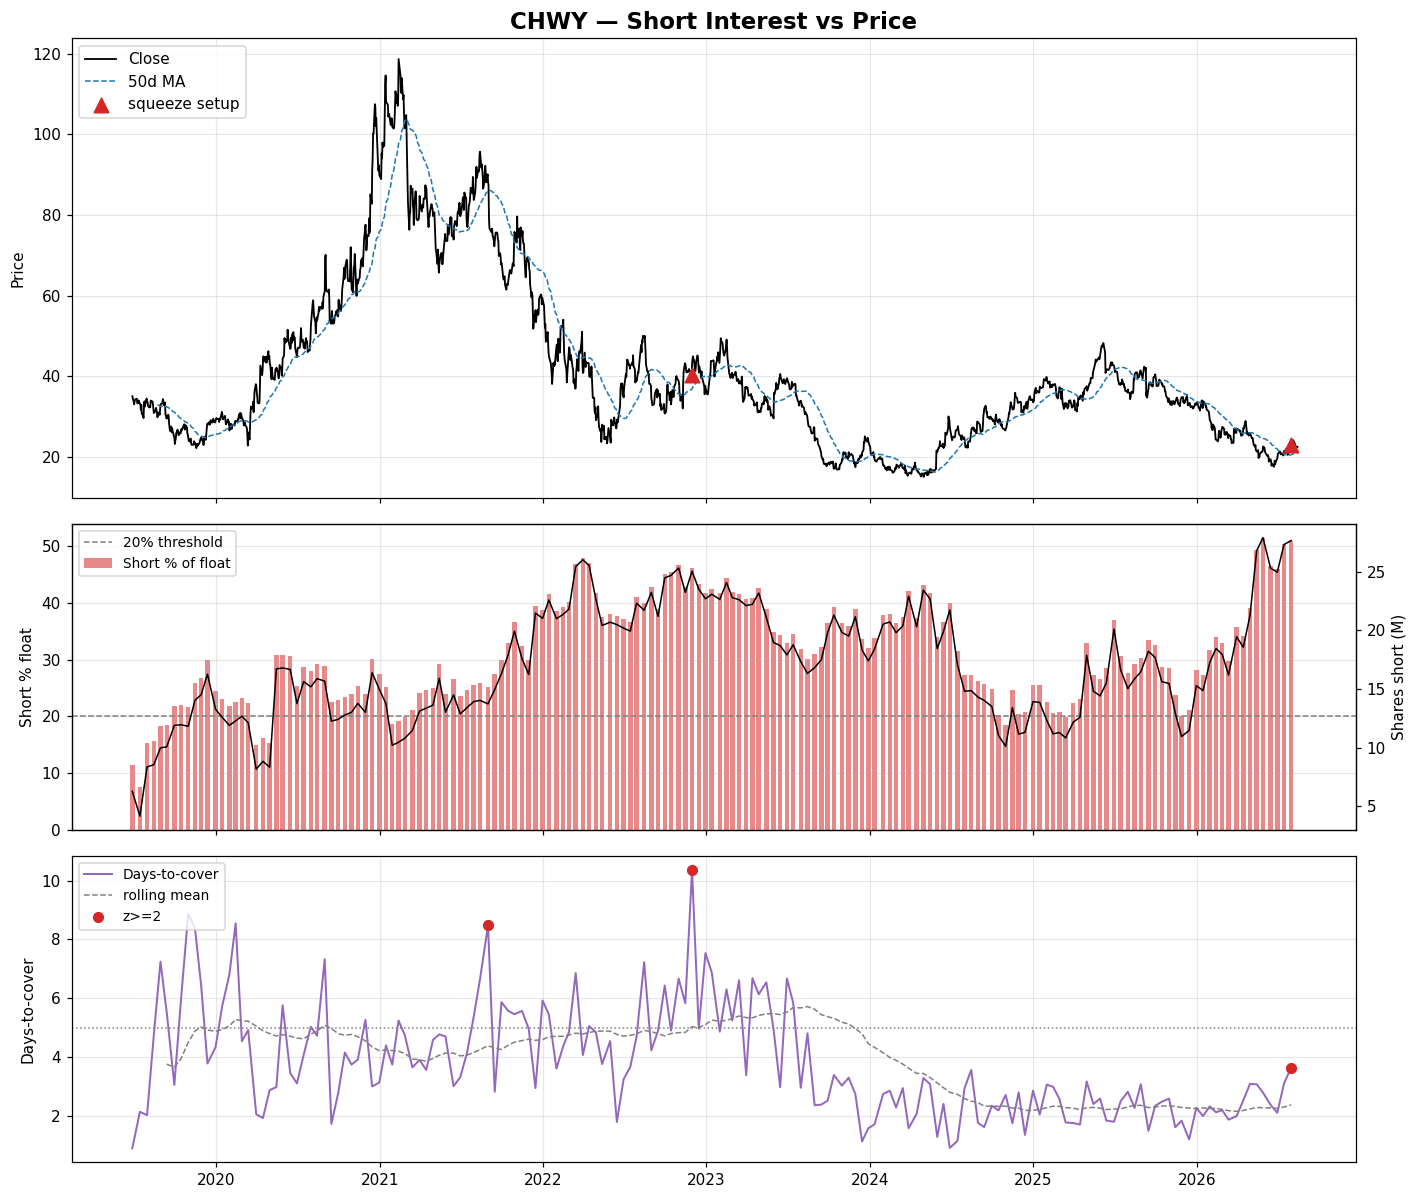
| CHWY | 1.26 | — | 50.9% | 3.6 | 2.3 | +1% |
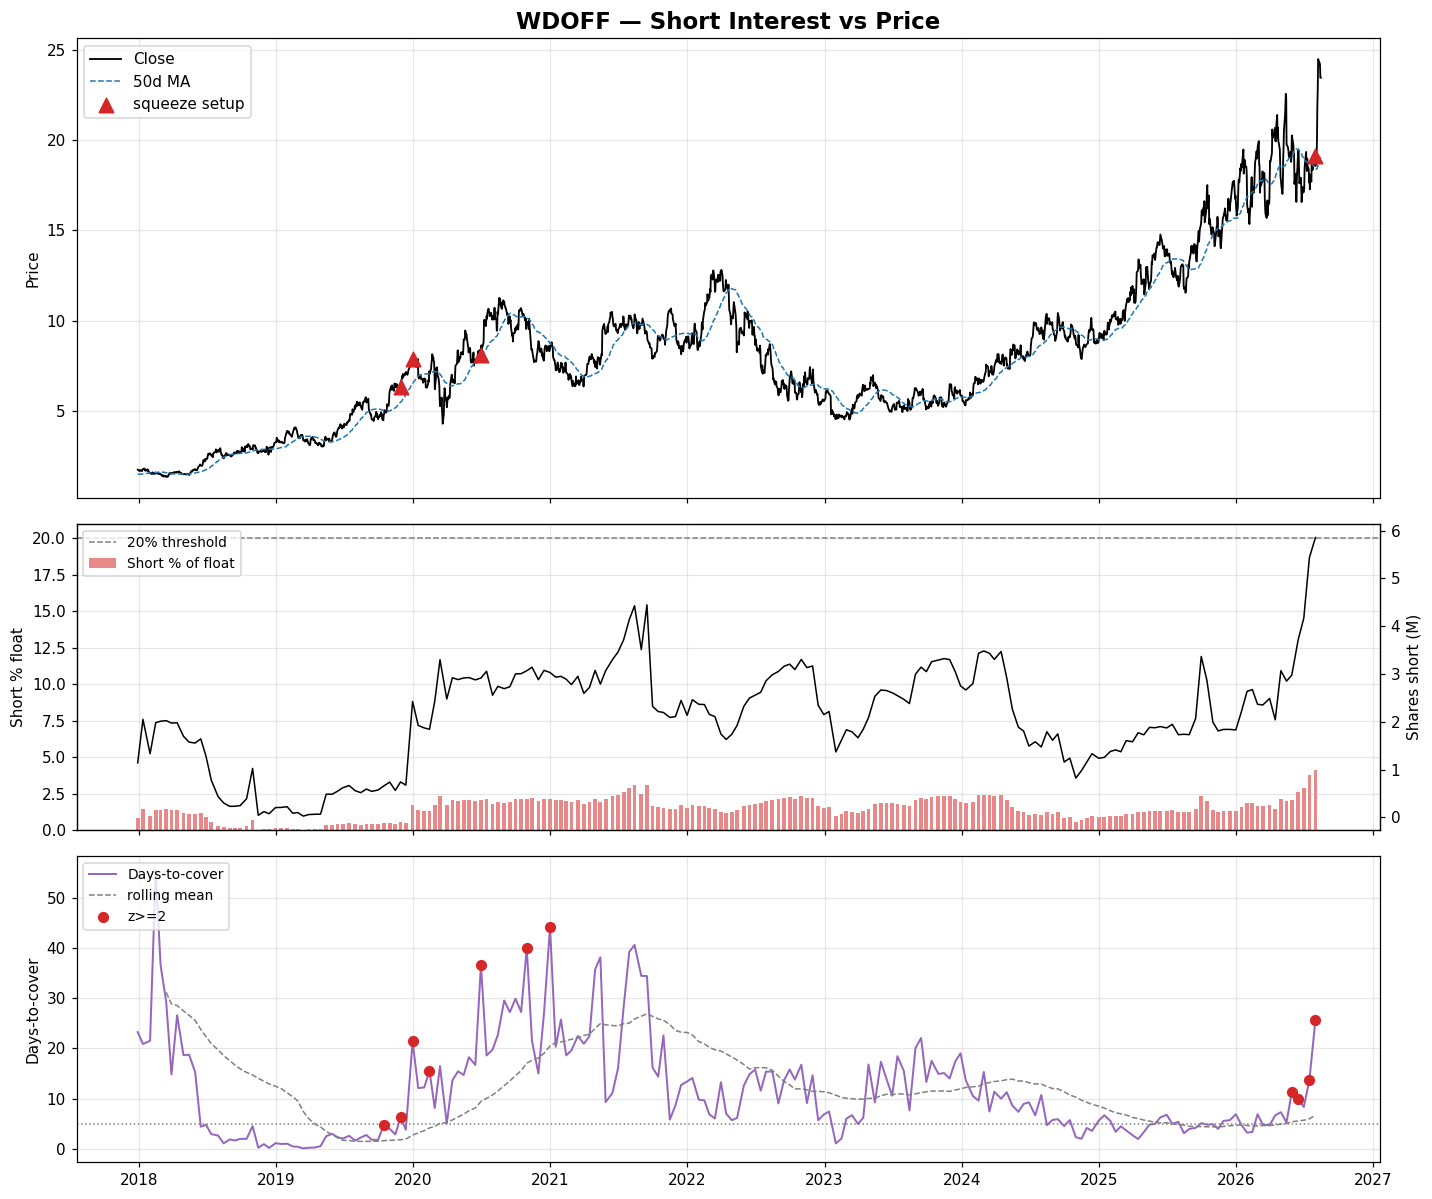
| WDOFF | 1.26 | — | 4.1% | 25.7 | 4.1 | +8% |
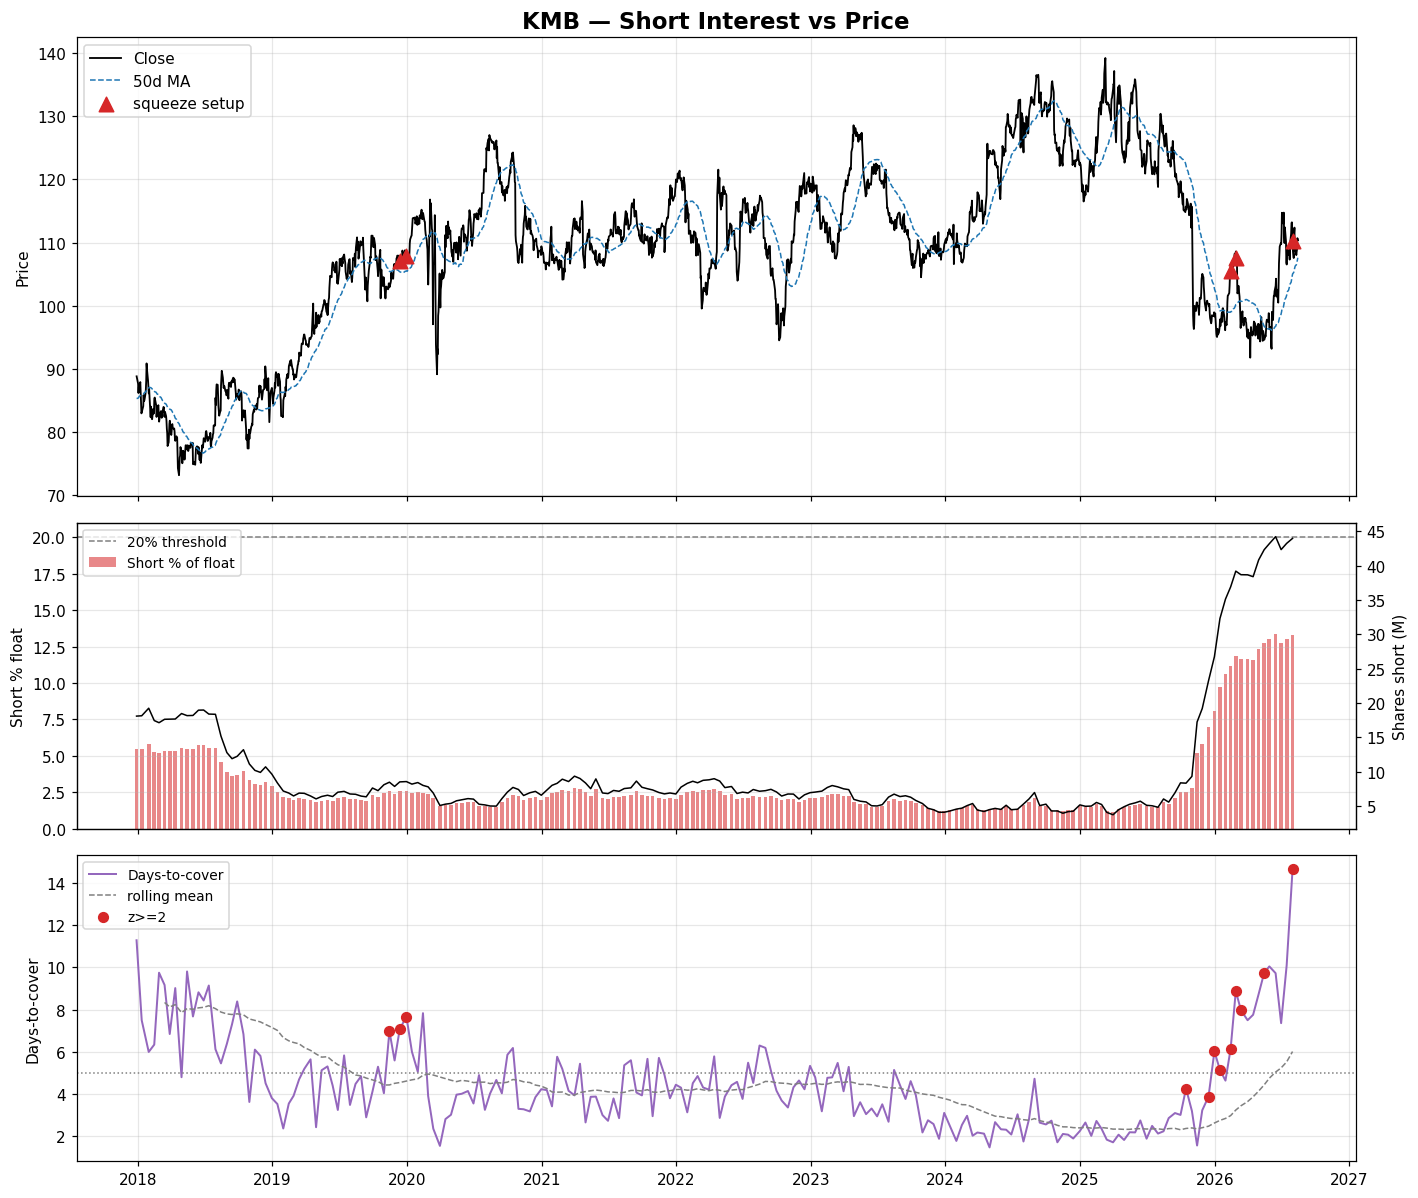
| KMB | 1.22 | — | 13.3% | 14.7 | 2.6 | +2% |
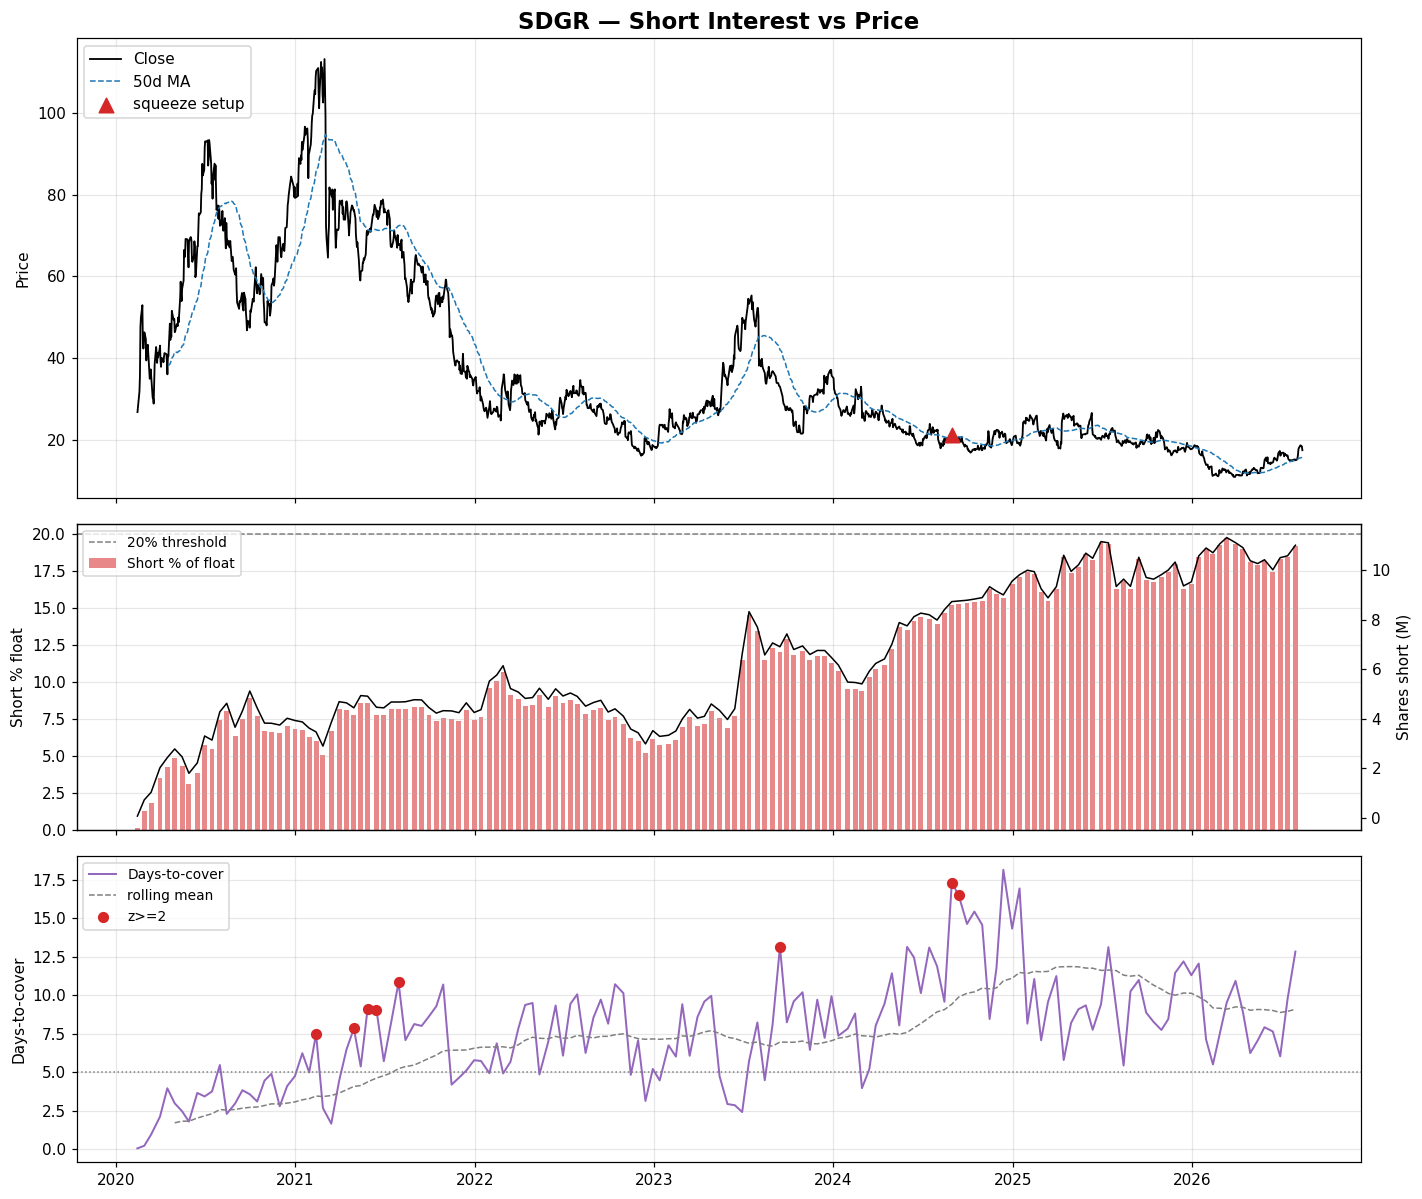
| SDGR | 1.19 | — | 19.2% | 12.8 | 1.7 | +4% |
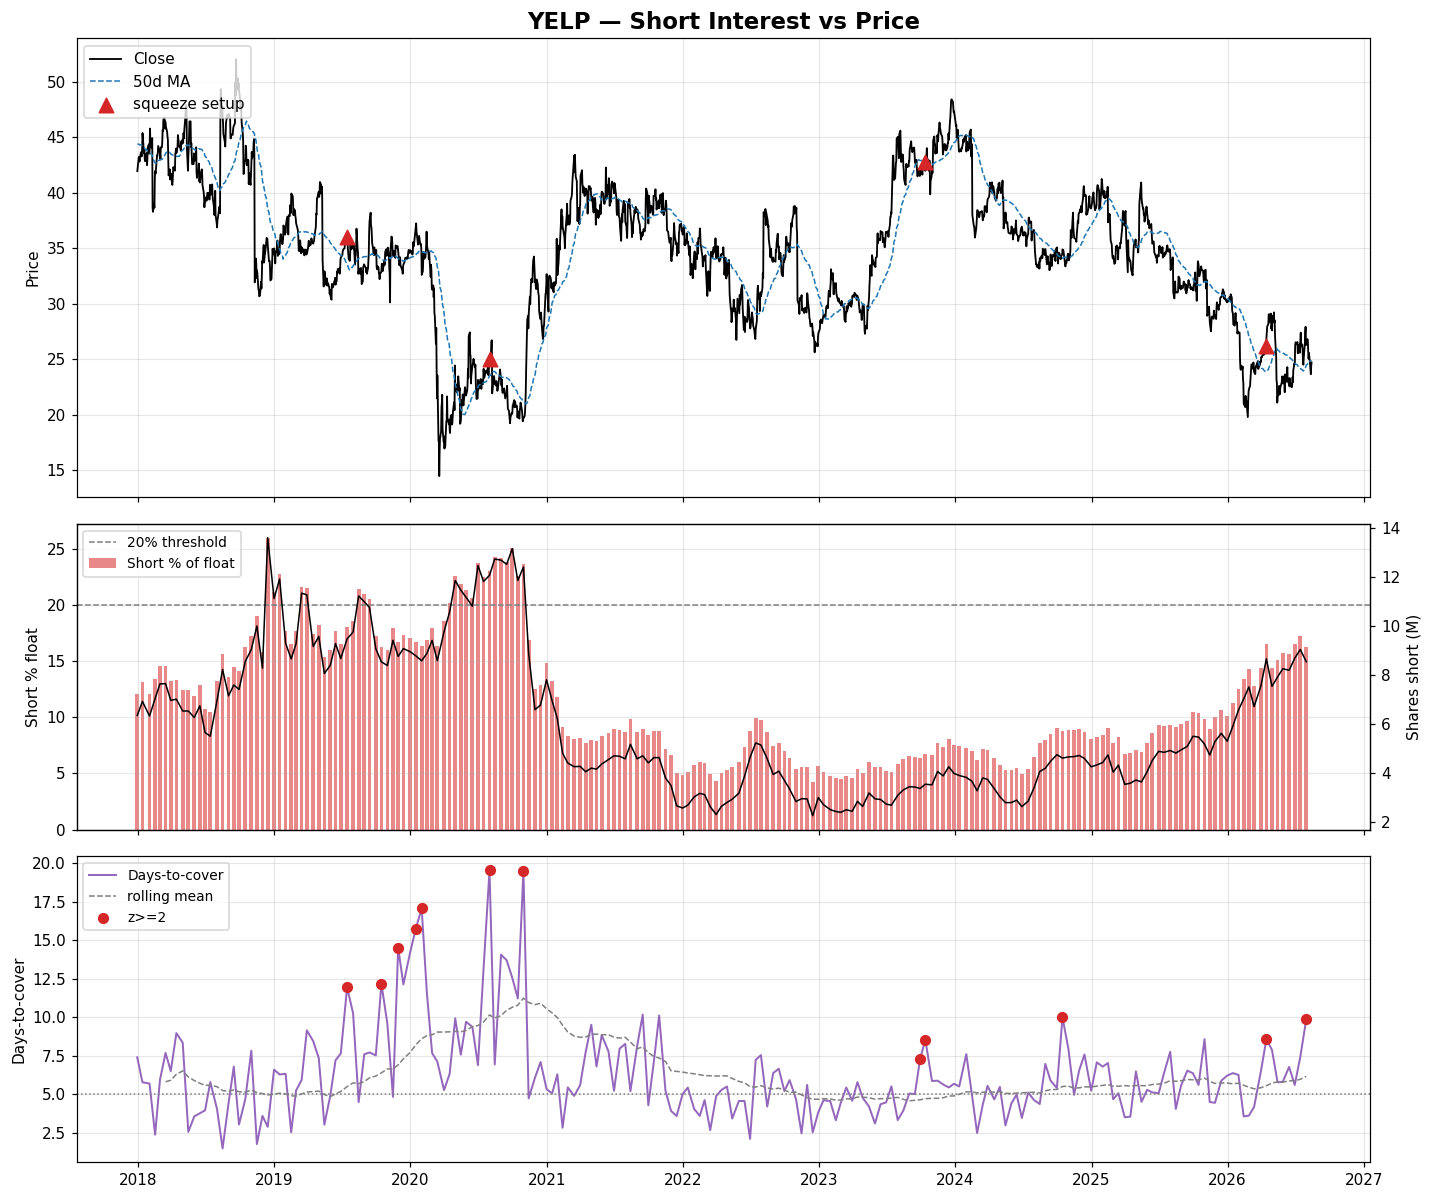
| YELP | 1.13 | — | 16.3% | 9.9 | 2.4 | -6% |
| PCVX | 1.13 | — | 10.6% | 14.8 | 2.1 | +2% |
| RMD | 1.11 | — | 10.9% | 14.2 | 2.0 | +16% |
| KLAR | 1.11 | — | 16.7% | 9.4 | 2.3 | -0% |
| SPTX | 1.07 | — | 9.7% | 30.8 | 1.8 | +39% |
| KYMR | 1.07 | — | 15.1% | 18.1 | 1.1 | +1% |
| WBI | 1.06 | — | 12.5% | 8.1 | 2.2 | +3% |
| SCCO | 1.06 | — | 13.0% | 9.8 | 1.4 | +9% |
| PBA | 1.06 | — | 2.1% | 14.5 | 2.6 | +25% |
| CLX | 1.05 | — | 11.2% | 6.0 | 3.1 | +16% |
| GME | 1.05 | — | 13.1% | 17.1 | 2.0 | -3% |
| LYV | 1.05 | — | 15.6% | 11.6 | 1.7 | -3% |
| TAP | 1.05 | — | 18.0% | 9.1 | 1.8 | -1% |
| FOXA | 1.04 | — | 13.5% | 11.5 | 1.9 | -8% |
| O | 1.04 | — | 4.8% | 9.7 | 2.3 | +13% |
Charts
IFF
GEN
CASY
IRON
ALT
CPB
CHWY
WDOFF
KMB
SDGR
YELP
PCVX
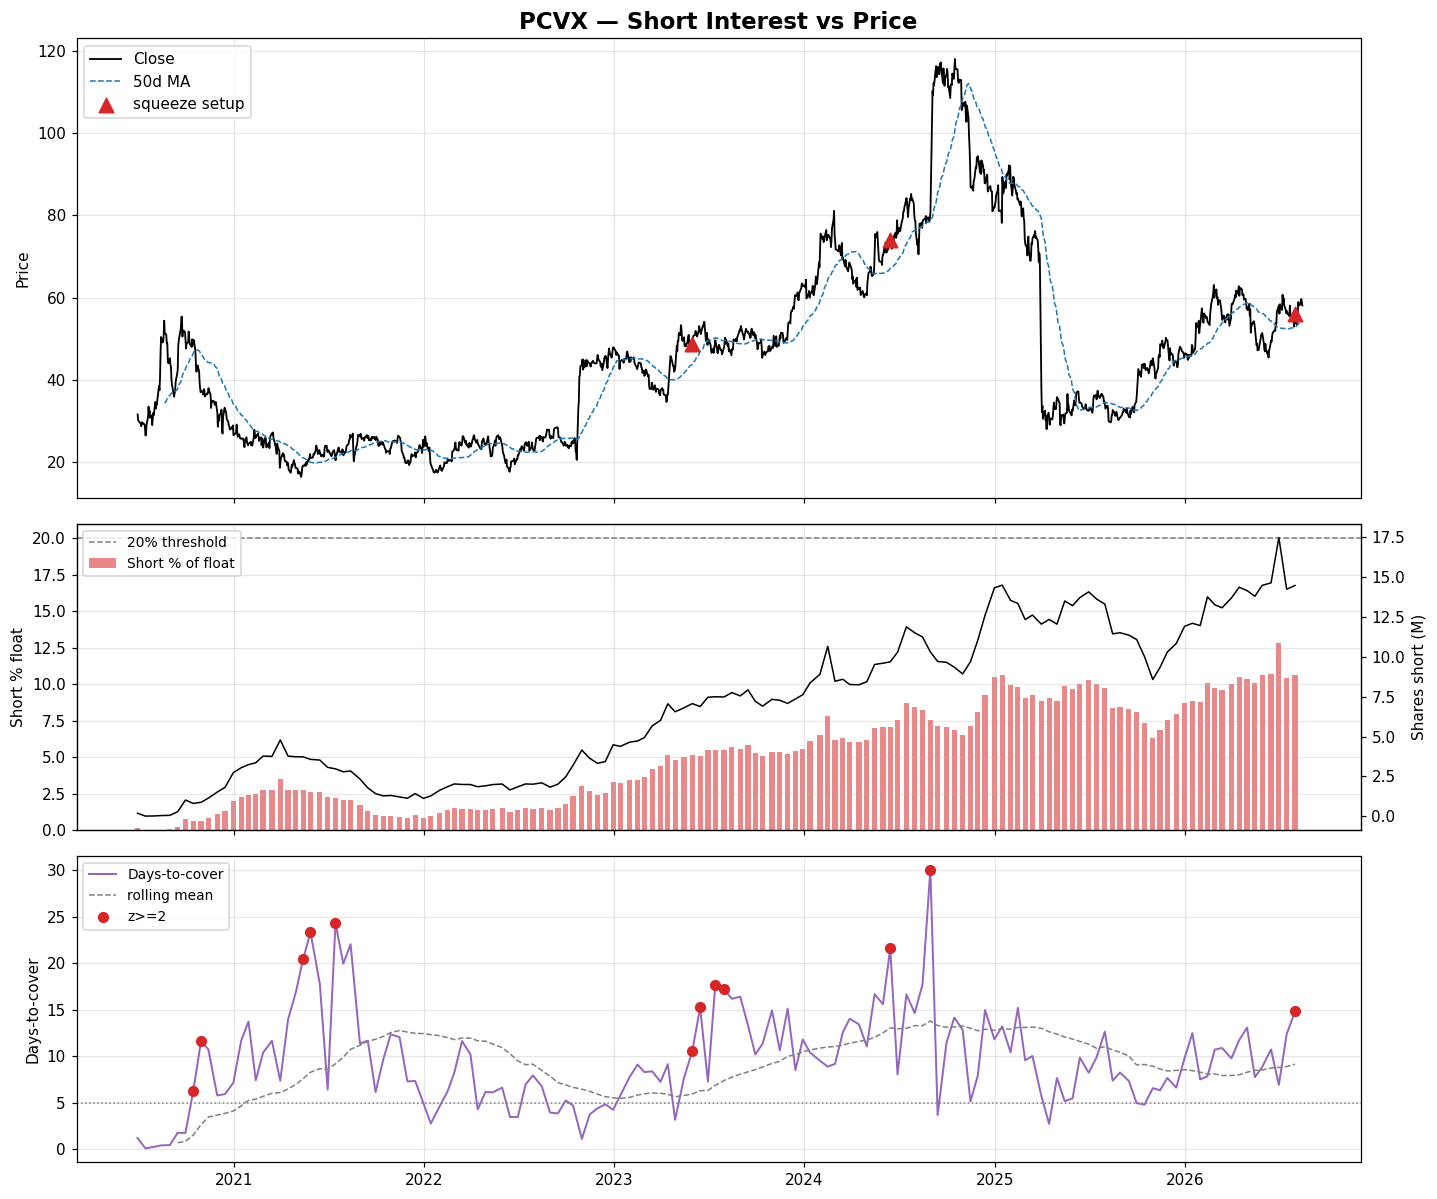
How to read this: a higher score means a more crowded, harder-to-cover short base that is still building while price reclaims its 50-day moving average — the classic squeeze setup. Days-to-cover is recomputed as shares-short / average-daily-volume (FINRA floors its own value at 1.00); the z-score compares it to the ticker's own history. Short interest is reported fortnightly with a ~2-day publication lag, so treat this as a swing-horizon watchlist, not an intraday signal.
This content is for informational purposes only and does not constitute financial, investment, or trading advice. Always consult a qualified financial professional before making any investment decisions.
Short-Squeeze Watch
FINRA consolidated short interest as of 2026-07-15. Scanned 6 US tickers; 1 flagged as potential short-squeeze setups.
⭐ 0 of these also show open-market insider buying in the last 90 days — the higher-conviction squeeze × insider subset, which is the only subset with a real forward edge in backtest. These are listed first and marked ⭐.
| Ticker | Score | Insider Buy | Short % Float | Days-to-Cover | DTC z | Δ Short Int |
|---|---|---|---|---|---|---|
| GME | 1.05 | — | 13.6% | 16.1 | 2.0 | -1% |
Charts
GME
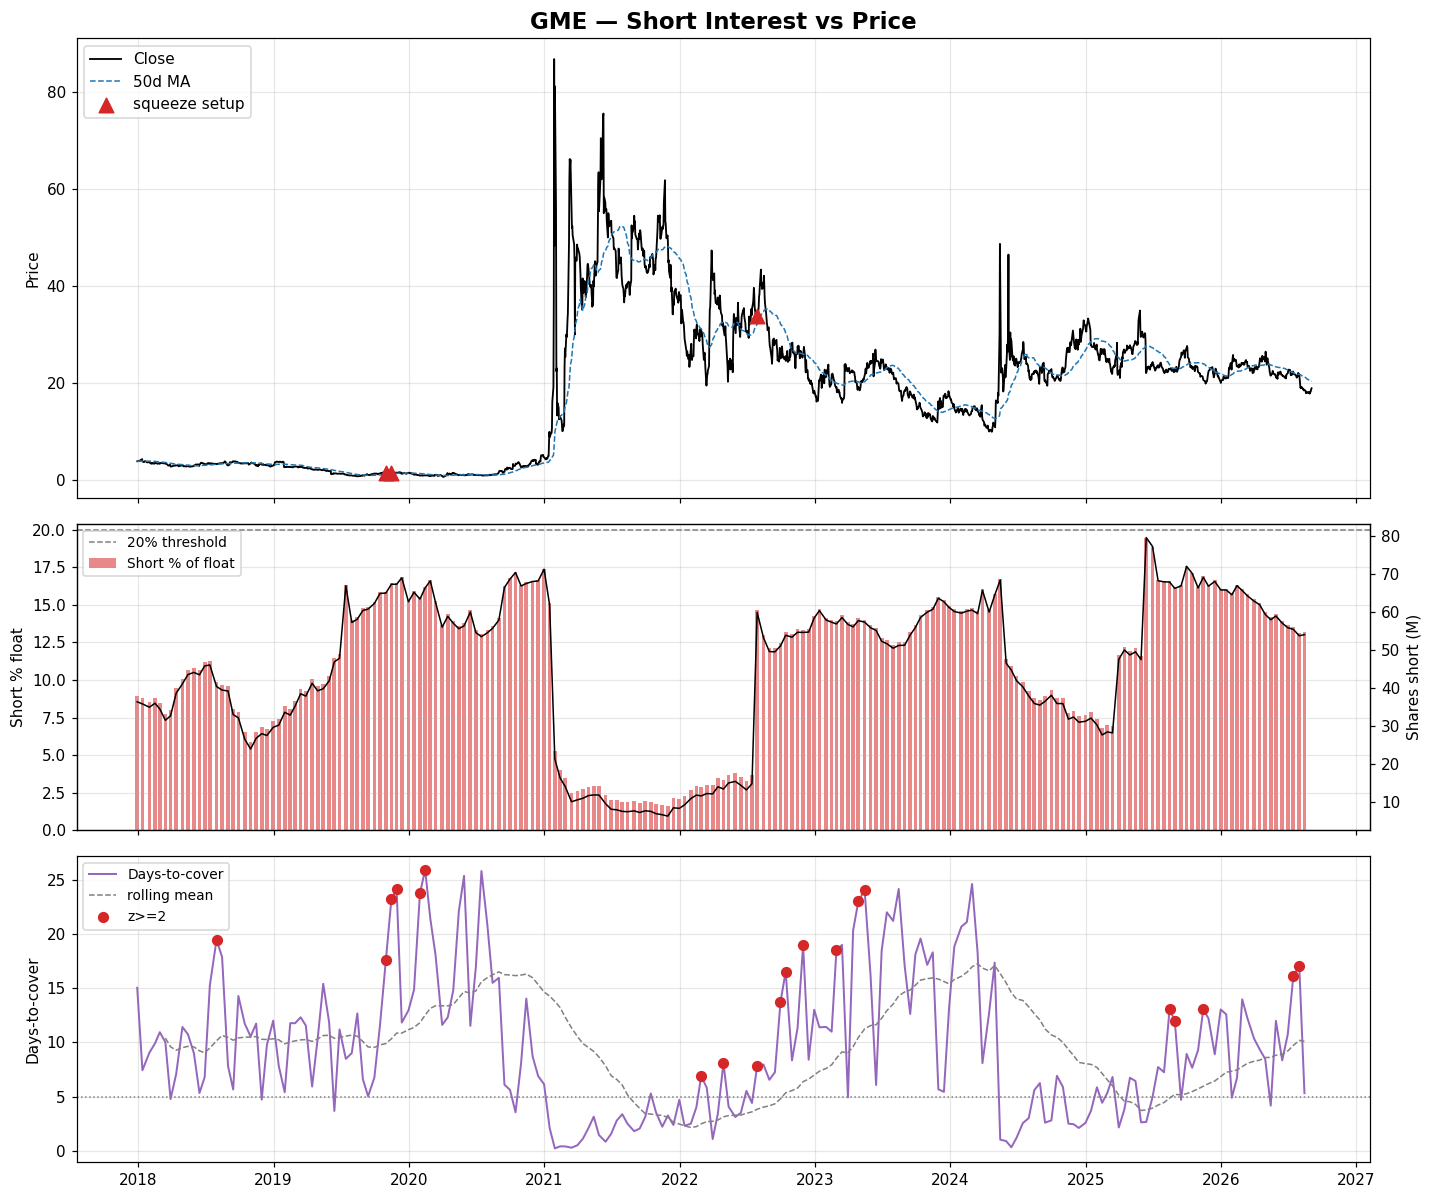
How to read this: a higher score means a more crowded, harder-to-cover short base that is still building while price reclaims its 50-day moving average — the classic squeeze setup. Days-to-cover is recomputed as shares-short / average-daily-volume (FINRA floors its own value at 1.00); the z-score compares it to the ticker's own history. Short interest is reported fortnightly with a ~2-day publication lag, so treat this as a swing-horizon watchlist, not an intraday signal.
This content is for informational purposes only and does not constitute financial, investment, or trading advice. Always consult a qualified financial professional before making any investment decisions.